Ellikarrmiut Economy (1997)
Animal Resource Use at Nash Harbor (49-NI-003), Nunivak Island, Alaska
Submitted in Partial Fulfillment of the Requirements for the Master of Science Degree Department of Anthropology, University of Oregon
Original Text June 9, 1997. Internet Text August 15, 1997; revised September 7, 1998
ABSTRACT: Analyses of faunal remains from middens at the Ellikarrmiut Village Site reveal a broadly-based late Thule economy, but with specialized spring and summer seasonal economies involving Pacific cod (Gadus macrocephalus), walrus (Odobenus rosmarus), seals (Phocidae), and cliff birds (Alcidae, Laridae, and Phalacrocoracidae). Patterns of butchery and refuse disposal emergent in faunal data, when compared with oral-historical and ethnographic data, suggest that the Ellikarrmiut relied most heavily on storage of cod and seals, and traded cliff bird skins with residents in Mekoryuk and on the mainland.
Note: in 1997 I used the term “Eskimo” to describe Cup’ig and Yupik peoples (who do not describe themselves as Inuit). At the time, it was suggested to me that this term was appropriate. I would not use this term to describe Cup’ig and Yupik peoples today.
Contents
1: Introduction and Background
In the early twentieth century, as today, almost 200 people lived on Nunivak Island (Griffin 1996). Almost all of them were Alaskan Eskimo peoples who spoke Cup’ig, a dialect of the mainland language Yup’ik. The people refer to themselves as Cupiit ("The People"), or Nunivarrmiut (“the people of Nunivak”). At that time, the Nunivarrmiut lived in several winter villages, migrating seasonally to camps for fishing, sealing, or caribou hunting (Lantis 1946). One of the most important villages on Nunivak was at Nash Harbor, a locale associated historically with several sealing locations, and known as a “spring camp;” a place for sealing, cod fishing, and bird hunting (Griffin 1996). My own research focuses on the zooarchaeological analysis of materials recovered from Ellikarrmiut, the "Old Village" at Nash Harbor. Through the careful analysis of animal remains from Nash Harbor, I can help describe a portion of Ellikarrmiut economic life: the capture of animals, and their butchery and use for food and other products.
Geography & Biogeography of Nunivak Island
Nunivak Island lies about 30 miles offshore from the delta of the Yukon and Kuskokwim Rivers, at about 60 north latitude (Figure 1.1). Lantis (1986) and Hartman and Johnson (1978) summarized the geography and climate of Nunivak. Winter weather on Nunivak is fiercely cold and wet, with temperatures falling to as low as -31 C. Summers are also cool and wet but mild, tending towards 15 to 20 C, and the vegetation on Nunivak is denser than the mainland tundra.
Because of its low potential for commercially-exploitable minerals, Nunivak Island has attracted little geological exploration (Hartman and Johnson 1978). Ganopole (1972) summarized the surficial geology of the island. Unlike the nearby Yukon-Kuskokwim delta, which consists of late Tertiary and Quaternary sediments, Quaternary volcanic rocks form the entire surface of the island. Much of the present-day tundra has developed directly on basaltic lava flows. Ganopole also noted polygonal columns in the sea cliffs. The low mountains on the island are the cinder cones of dormant or extinct volcanoes. A small deposit of Cretaceous sandstone bearing non commerical grade coal surrounds Dahtkit Cove, on the northern shore of the island, east of Nash Harbor.

Figure 1.1, Lower Yukon-Kuskokwim Delta region. After Nowak, 1982.
The island sits on a long, shallow shelf that receives seasonal Pacific and deep Bering Sea upwellings, as well as silty currents from the Yukon-Kuskokwim delta (Hartman and Johnson 1978). Salmon (Oncorhynchus sp.), Pacific cod (Gadus macrocephalus), Pacific halibut (Hippoglossus stenolepis), flounders and soles (Pleuronectidae), needlefish (Ammodytes hexapterus), Dolly Varden (Salvelinus malma), tomcod (Microgadus proximus), and Pacific herring (Clupea harengus) thrive on the rich plankton of the near shore currents (Lantis 1986:209). The dense fisheries support a variety of pinnipeds (Burt and Grossenheider 1976; Nowak 1988b), including Northern sea lions (Eumetopias jubatas), Alaskan fur seals (Callorhinus ursinus), harbor seals (Phoca vitulina), ribbon seals (Histriophoca fasciata) and bearded seals (Erignathus barbatus). The shallow waters around Nunivak generally host low cetacean populations, although beluga (Delphinapterus leucas), Dall porpoise (Phocoenoides dalli), and orcas (Orcinas orca) occasionally visit the area. In late winter through spring, walruses (Odobenus rosmarus) abound in Nunivak waters, feeding on deepwater clams living on the Nunivak shelf. In a few areas on the Nunivak shore live intertidal shellfish, including blue mussels (Mytilus edulis) and sandy-bottom clams (Macoma sp.) (McConnaughey and McConnaughey 1985).
Many of the terrestrial fauna depend directly on marine resources; Nunivak boasts a dense population of migratory sea-birds, especially on the steep cliffs forming the northwestern corner of the island. A lack of predators other than foxes (Vulpes sp.) and minks and weasels (Mustelidae), coupled with the large nearshore fish populations make Nunivak a prime rookery for at least 89 bird species (Swarth 1934: 11–15). Cormorants (Phalacrocoracidae), puffins, auklets, and related birds (Alcidae), and gulls (Laridae) all roost seasonally on the cliffs of Nunivak Island. The inland tundra also supports migratory populations of loons (Gaviidae), grebes (Podicipedidae), and ducks and other waterfowl (Anatidae) (Hoffman 1990; Swarth 1934).
Arctic caribou (Rangifer arcticus) are the only large terrestrial mammals found in Nunivak archaeological sites, but they were rapidly exterminated in the 1880s by Cupiit and mainland Yupiit peoples armed with rifles (Lantis 1986:210). Americans introduced Greenland reindeer (Rangifer tarandus) and musk oxen (Ovibos moschatus) to the island this century (Griffin 1996; Lantis 1946). A small population of wolves (Canis lupus) once lived on Nunivak Island, but was wiped out by the middle of the twentieth century (Griffin 1996). Small rodents (Cricetidae), shrews (Insectivora), foxes, and mustelids are the only small mammals (Lantis 1986: 209; Burt and Grossenheider 1976). Domestic dogs (Canis familiaris) accompanied human settlers on the island (Lantis 1946).
Archaeology on Nunivak Island & Lower Yukon-Kuskokwim Delta
The earliest documented evidence for human occupation on Nunivak Island appears with Norton Tradition materials (Figure 1.2). Archaeological investigations by the Bureau of Indian Affairs on Nunivak recovered materials radiocarbon dated to 670 BC (United States Bureau of Indian Affairs 1995, in Griffin 1996). At the 49-NI-028 site near Mekoryuk Village, Nowak (1982, 1988a) identified two components he termed the Early Duchikmiut Phase (150 BC to AD 250) and the Late Duchikmiut Phase (AD 250 to 650), containing typologically Norton check-stamped pottery. Nowak (1982: 78–87) described a technological variation between the Early and Late phases. Small-gauge thin walled check-stamped pottery and small ground and chipped lithic tools predominated in the Early phase; thick-walled large-gauge check-stamped pottery, bone tools, and large ground slate tools (including knives) formed the bulk of the Late phase assemblage.
Nowak (1982) apparently recovered a large faunal assemblage from the Mekoryuk sites, but this assemblage is poorly documented. He reported finding hair seal, bearded seal, sea lion, and beluga whale in large quantities at 49-NI-028. Chatters (1972) described a preponderance of caribou remains in one level from a single house pit at the Mekoryuk Village sites; he also reported large numbers of marsh birds’ remains. Nowak and his crew found more than 1400 notched netsinkers of undocumented size and uncertain function. More than 1000 of these netsinkers appear in the Late Phase, although Nowak believed concentrations of netsinkers in the Late Phase represented caches rather than net remains, with the implication that the greater number of netsinkers in this phase may not have represented the increased use of nets. At any rate, the large netsinker assemblage suggested an increased reliance on mass fish-harvesting or seal-netting. Nowak’s interpretation of the lack of change in the faunal assemblage from Norton to late historic times indicated to him that historic Nunivarrmiut have been living in much the same way for more than 2000 years.
Chatters (1972), in a brief report to Nowak, outlined the recovery of mammal and bird remains from several units at the Mekoryuk Village sites. Many of Chatters’ results were difficult to interpret, since Chatters referred to the sites with their field designations. Without Nowak’s field notes or Chatter’s laboratory notes, I could ascertain to which sites and periods of occupation Chatters refers. Moreover, I had no information on conditions of excavation, such as screen size employed (if any). While most of Chatters’ analyses appear to refer to Norton-era occupations that predate materials in my study, I will occasionally refer to his work when discussing the implications of faunal distributions at Nash Harbor.

Figure 1.2, Generalized chronology of archaeological sequences on Nunivak Island (Nowak
1988a, 1988b) and in the greater Bering Sea region (Dumond 1986, 1987)
Elsewhere on the Bering Sea Alaska mainland, Dumond (1982, 1986) saw evidence that Norton peoples organized their subsistence activities around caribou and sea mammal hunting, and riverine fishing. Compared with the pre-Norton Arctic Small Tool tradition (evidence for which has not been discovered on Nunivak Island), mainland Norton sites appear with the establishment of larger, permanent coastal villages, and an increase in fishing and sea mammal hunting generally (Dumond 1982). An increase in netsinkers in Norton assemblages compared to Arctic Small Tool assemblages and an apparent increase in the intensity of riverine occupations suggested to Lutz (1982) greater exploitation of anadromous fish. Dumond (1987: 127) characterized late Norton peoples as riverine fishers, catching salmon with traps or spears.
Shaw (1983), in his work on the Yukon-Kuskokwim delta, reported netting technologies in assemblages associated with typologically late Norton check-stamped pottery. At 49-MAR-007 on the Manokinak River, Shaw (1983: 118–130, 245–252, 264–265) recovered a single net weight and the remains of a net, in addition to bone fishhooks, dart points, and wooden fishing implements, including a fish trap and fish clubs. Carved wooden artifacts representing cranes or ducks and a puffin bill decoration reflect a symbolic or ideological interest in birds (Shaw 1983: 156–161, 252, 360). Norton settlements on the delta were clustered at coastal localities with protected embayments, on headlands, or along rivers in the interior uplands (Shaw 1982: 70). Shaw (1982: 71; 1983: 359–360), and Shaw and Holmes (1982) characterized Norton hunting and fishing as “labor-intensive,” relying mostly on large but infrequent takes of each major resource: fish (especially salmon), seals, and caribou. These three resources form the base of Bockstoce’s (1973) “tripartite” economy. If Norton people could rely on at least two of the resources, they could remain well-fed and healthy. However, if more than one of the resources collapsed, the people faced hard times.
Researchers have published very little data on Thule occupations on Nunivak Island. Nowak (1988a) mentioned a potential Thule-era occupation (A. D. 1200) at the Mekoryuk River shell midden site 49-NI-030, and noted that he identified neither walrus nor beluga at the site, but that sea lions "appear in small numbers" (Nowak 1988b: 46). Nowak (1982) seems to have dismissed the possibility of substantial changes after about 2000 B.P. in Nunivarrmiut subsistence activities, based on his summary analysis of the faunal assemblage from the Mekoryuk Village site, 49-NI-028.
Data from elsewhere on the Alaskan Bering Sea coast can shed light on post-Norton subsistence patterns. The people of the Thule Tradition (after AD 1000) established the classic Arctic lifeway that continued until contact times. Evidence for early Thule occupations appears infrequently on the delta, although this is probably an artifact of the lack of archaeological investigation in the region. Shaw (1983) uncovered a late Norton component he terms the Yukon-Kuskokwim Phase (AD 400 1000) from 49-MAR-007, and a probable hiatus in occupation from AD 1300 to the recent past. The late appearance of net technology and bird remains at the site led Shaw to hypothesize that the people at the Manokinak River had adapted net technology for hunting waterfowl and small terrestrial mammals (Shaw 1982: 71–72). Ethnohistoric data from Nunivak (Hoffman 1990; Pratt 1990) also suggests that cliff-dwelling birds had become an important resource for Thule peoples. Avian resources added a fourth leg to Bockstoce’s (1973) tripartite economy, making it generally more stable. By Thule times, Arctic hunters could operate solo or in small groups year-round, instead of relying on more labor-intensive and spatially and temporally restricted resource exploitation practices.
2: Archaeology at Nash Harbor
“Nash Harbor” refers to both the body of water and to the villages built at the mouth of the Ellikarrmiut River. “Ellikarrmiut” refers to the people who once lived here; in Cup’ig it means “People of the Sharpening Stone” (Griffin 1996). Two former villages are visible at Nash Harbor today. Area 1 lies on the east side of the Ellikarrmiut River; Mekoryuk residents commonly call this the “Old Village,” or Ellikarrmiut Village. Nowak’s (1988) investigations at the site found evidence for occupation here as early as AD 350. An epidemic—perhaps influenza—at Ellikarrmiut sometime around AD 1890 prompted the villagers to relocate across the river to the “New Village” or Qimugglugpaqmiut (“People of the Big Bad Dog”) (Griffin 1996), which I refer to as Area 2. Area 1 today is comprised of several deep (1 to 2 m), distinct house depressions, usually clustered into house complexes linked by common entrances. Tall beach grass (probably dune grass, Elymus mollis, Swarth 1934: 9), covers the surface of the site, partially or completely obscuring the structural features underneath.
Part of the Nash Harbor Village is located atop a long sandy spit projecting west across a broad lagoon formed by the Ellikarrmiut River (Figure 2.1). This spit nearly blocks the river, narrowing its outlet to about 5 meters. A grassy marsh has formed in the backwater behind the sand spit. Large subangular sand grains deposited in finely striated layers appear to comprise the basement material for Area 1. The tundra to the east of the site may have developed on rubble and igneous rock beach shingle eroding from Azwiryuk Bluff. On the beach exposure, these igneous rocks are rounded, flat stones 5 to 30 cm wide and 5 to 10 cm thick, well sorted by size and deposited in distinctly bedded planes interspersed with coarse beach sands. This suggests that the tundra east of Ellikarrmiut is formed on top of a series of shingle backbeaches (Bird 1984:112) similar to the beach east of the village today.
The spit underlying the village, however, seems to have formed entirely from sand deposited at the mouth of the Ellikarrmiut River by river sediments directed along shore by oblique longshore and offshore currents (Bird 1984:122–126). The finely-striated sands of the dune imply that the height of the dune derives mainly from the eolian redeposition of fine sands from the exposed beach. Dune grass stabilizes the terrace, especially the southward lee face (Bird 1984:176–179).

Figure 2.1, maps of 49-NI-003, Area 1, the “Old Nash Harbor Village,” and the lower
Nash Harbor area and Ellikarrmiut River valley. After Griffin 1996 and U.S.G.S. 7.5'
Series, Nunivak West A6.
1996 Archaeological Investigations at Nash Harbor
In the summer of 1996, I joined University of Oregon doctoral candidate Dennis Griffin and Oregon State University master’s student Chris Broyles in the archaeological exploration of Nash Harbor. Griffin also hired five Mekoryuk High School students through a grant from the Summer Youth Training Partnership Program (SYTPP). Griffin, Broyles, and I were jointly responsible for selecting units for excavation and overseeing the SYTPP workers’ screening, survey, and excavations. Broyles and I selected for excavation two shellfish and fishbone middens (TU4 and TU7, Figure 2.1) visible in the eroding beach bank. Griffin concentrated his efforts on the excavation of house floors, especially near the centers of houses where he thought he might find hearths. I also screened displaced slump material obscuring portions of a beach cutbank profile.
The field crew surveyed the Nash Harbor sites using an optical transit. An arbitrary metric grid was superimposed over the area; all units were laid in using coordinates of this grid. The field crew excavated test units in 10 cm arbitrary levels using trowels; slumps were cleared using shovels. The original excavation plan called for screening 3 quadrants of each 1 m square with 1/4" dry screen, and screening the remaining quadrant with 1/8" dry screen. Time and labor pressures forced us to abandon this strategy in favor of screening all material from a provenience with 1/4" screen, and retaining a two liter bulk sample from the general provenience. Additional bulk samples of midden materials were retained, as were discrete charcoal samples for 14C dating. Worked tools and other finished artifacts found during excavation were recorded and catalogued separately from the general screen sample, and recorded in situ where possible.
Excavators made a profile drawing of two walls from each finished test unit, and soil samples were retained from most strata exposed in profile. I also made a sketch map of the exposed beach cutbank in order to target midden areas that might prove useful for faunal recovery, and refined my sketch profiles in two areas of the beach to help fix stratigraphic sequences for nearby test units. Soils were mapped with a methodology that favored identification of buried surfaces and depositional episodes (Stein 1990). I designated proposed major depositional sequences with Roman numerals; substrata that may represent single depositional episodes within the stratum are designated with Arabic numerals. Therefore, Stratum III-1 indicates the first identified substratum in major Stratum III. Conjectured soil types and horizons were noted using basic soil science terminology (Holliday and Goldberg 1992).

Figure 2.2, Stratigraphic profile map of Test Unit 4, south and east walls. Faunal
samples were taken from indicated levels. Most minor substrata omitted for clarity.
My own work concentrated on the study of faunal materials from two midden areas at the old village site, NH1. Preliminary stratigraphic profiles made on the eroded beach face identified several discrete midden areas that yielded abundant faunal material for study. I identified two midden deposits for excavation and laid out test units in each.
Test Unit 4 (TU4) is located just outside an entryway to a large house complex. Extensive deposits of fish, bird, and mammal bone were eroding from the bank in this area, and several large flat rocks and wooden timbers suggested that the unit might also contain buried structural members. Excavation of TU4 began at the top of the beach exposure. At around 50 cm below surface, we encountered soil frozen too hard to excavate and were forced to abandon work in the unit. We opened a second test unit (TU5) immediately south of TU4, hoping to stagger excavation of TU4 and TU5 to allow the soil to thaw. The rates of thaw proved too slow, however, so I concentrated my excavations in the north half of TU4, which had thawed about 50 cm back from the edge of the bank.
Around 160 cm below surface, the excavation crew encountered several large, flat rocks stacked two to three deep. None of these large rocks showed evidence of having been grinding stones or hearth stones; at the time, we conjectured that they may have been “flagstones” lining the floor of a food cache or sauna. This collection of rocks was dubbed “Feature 1,” and divided the excavation of TU4 into two vertical sections, top and bottom. Several of the stones proved too large to remove without damaging the excavation unit walls, and were left in situ with a thick pedestal underneath. Permafrost, Feature 1, and the depth of the unit conspired to make TU4 somewhat less than ideal in shape (Figure 2.2).
I proposed a division of the cultural sequence reflected in TU4 into at least 3 distinct episodes. Griffin and I speculated that the large upright timbers and mats of sod and moss present in Stratum IV signified the remains of a structure. The structure was eventually abandoned and collapsed, and subsequently covered by a layer of sand (Substratum III-1) and some cultural debris (Substratum III-2), which may have been associated with the construction in the second episode of Feature 1. In the third episode, people probably living in a nearby house complex heaped trash on top of Feature 1 (Stratum II).
Excavation of TU4 below 240 cm below surface partially exposed the anterior occipital margin of a large walrus skull, protruding from the west wall into the unit. After excavation of the unit, Broyles and I removed this skull and some surrounding soil. Two holes had been drilled in the nasal/maxillary region of the walrus skull, and the tusks removed by tapping on a dowel or wedge inserted through the drilled holes. As a byproduct of sample unit selection (see Section 3, below) this skull and some other walrus remains from Test Unit 4 are not included in the sample of analyzed faunal material.
Test Unit 7 (TU7) was located some 15 meters east of TU4. It sat about four meters east of an opening to a small house complex that was truncated by beach erosion. TU7 was probably associated with this feature or with a house that has eroded entirely into the sea. Structural members visible in the bank about eight meters east of the midden may have been all that remain of this conjectured dwelling.

Figure 2.3, Stratigraphic profile map of Test Unit 7, south and west walls. Faunal
samples were taken from indicated levels. Most minor substrata omitted for clarity.
TU7 proved relatively shallow and free of permafrost. A lens of mussel and clam shell and some fishbone was visible from the beach; sketch profiles and slump clearing revealed a single intact midden deposit that we hoped would prove fruitful for faunal research. Like TU4, TU7 has an irregular shape due to the contour of the beach cutbank; the unit was extended in the northwest corner to reach the edge of the bank (Figure 2.3). Otherwise, excavation of the unit proved unexceptional.
The stratigraphy of TU7 probably represents no more than two occupational episodes. In the first episode (Stratum III), Ellikarrmiut people probably performed some outdoor activity, probably shellfish or plant processing, directly on beach sands. Alternately, the area may have been a lightly-used trash area, not an activity site. The conjectured break between Substrata III-1 and III-2 may represent a brief hiatus of activity. In the second episode, Ellikarrmiut people deposited shellfish debris (Stratum II). Although a stable surface may bound the top of Stratum III, very little time may have elapsed between the deposition of Stratum III and Stratum II materials.
Radiocarbon Dates from Test Units 4 & 7
The excavation crew recovered several wood charcoal samples from most strata. All samples were taken from single objects (to avoid averaging results from several samples throughout an excavation unit), and sealed in plastic bags for shipping to Oregon. Dennis Griffin cleaned and dried samples for shipping to Beta-Analytic laboratories. I calibrated calendar dates using Beta Analytic’s calibrations, and the University of Washington’s CALIB computer program; both calibration methods use the 1993 Pretoria calibration curve for short-lived samples (Gillespie 1986; Stuiver, et al., 1993; Vogel, et al., 1993). I calculated all statistical tests using CALIB and Michael Miller's Probability Calculator program. Figure 2.4 summarizes the range of calibrated calendar dates from the TU4 and TU7 midden deposits.
Radiocarbon-dating results from the Test Unit 4, Level 16 sample (above Feature 1) yielded a conventional radiocarbon age of 340 +/- 80 R.Y.B.P. Owing to multiple intercepts with the calibration curve, calibration at the 2 sigma level yielded three ranges calendar dates: AD 1425 to 1675, AD 1770 to 1800, and AD 1940 to 1950. Calibration at the 1 sigma level generated a more narrow range of possible dates, AD 1455 to 1655. Results from TU4, Level 25 yielded a conventional radiocarbon age 370 +/- 40 R.Y.B.P.; at 2 sigma this represents calendar dates of AD 1445 to 1645 (2 sigma), and AD 1460 to 1525 and AD 1560 to 1630 (1 sigma). The close probable ages of these two samples suggested that these units are statistically identical. Two-tailed t-distribution and chi-square testing showed these samples to be the same at the 95% level (T' = .11; X2(.05) = 3.84). I then computed pooled average dates for the TU4 samples, yielding a radiocarbon age of 364 +/- 36, with calibrated calendar ages of AD 1446 to 1644 (2 sigma), and AD 1471 to 1526 and AD 1556 to 1632 (2 sigma).

Figure 2.4: Calibrated radiocarbon to calendar dates for samples from TU 4 and TU7
middens. Dark bars indicate 1 sigma calibrated results; light bars indicate 2 sigma
calibrated results. Average for TU 4 was computed from weighted mean dates for level
16 and level 25 samples. Average for all midden samples was computed from weighted mean
dates for TU 4, levels 16 and 25, and TU 7, level 13.
Only one sample obtained from TU7 has been radiocarbon-dated. A single piece of wood charcoal from the boundary of Stratum III and Stratum IV yielded a conventional age of 350 +/- 40 R.Y.B.P., or calibrated calendar dates of AD 1450 to 1650 (2 sigma) and AD 1475 to 1640 (1 sigma). Since this date was derived from the boundary between anthropic soils and the sterile basement sands, it represented a lower boundary for the entire unit, not a date from the midden deposits per se. Considering the rapidity with which a meter of debris accumulated in TU4 (between levels 25 and 16), and a lack of historic Euroamerican artifacts in TU7, I think it probable that the radiocarbon date derived from TU7 represents the age of the entire test unit.
I tested the TU7 sample with the TU4 samples for statistical similarity, again finding them to be statistically the same at the 95% level (T' = .18; X2(.05) = 5.99). Confident that the radiocarbon dates all derive from the same statistical population, I calculated a pooled mean date for both midden deposits at a radiocarbon age of 358 +/- 27 BP. This yielded calibrated calendar dates of AD 1479 to 1525 and AD 1559 to 1631 (1 sigma), and AD 1456 to 1640 (2 sigma). With three dates from several different horizontal and vertical proveniences, I can confidently conclude that both midden deposits represent nearly contemporaneous events, between AD 1456 and AD 1640. Faunal analysis from the two midden deposits therefore provides a picture of Ellikarrmiut economic life around AD 1550.
Table of Contents
3: Faunal Research: Goals & Methods
Analyses of the faunal materials from the TU4 and TU7 allowed me to address several questions concerning the animal exploitation habits of the Ellikarrmiut people. Through the study of spatial distributions of faunal material abundances in selected samples, I could approach the following issues:
- What were the general subsistence patterns at Nash Harbor for the time period (AD 1450 to 1640) reflected by selected samples?
- What activities were represented by remains in each midden deposit?
- During what times of year was Nash Harbor inhabited, and during which seasons were certain animal procurement and processing activities important?
- Which habitats near Nash Harbor did the Ellikarrmiut Village people exploit?
- How did the results of faunal analyses compare to oral historical data about animal resource use at Nash Harbor and on Nunivak Island?
Methods of Faunal Analysis
Before I could begin to analyze the faunal materials from Nash Harbor, I needed to separate animal remains from other archaeological materials, and to identify potentially informative areas for analysis. The Nash Harbor Project employed several University of Oregon students to process recovered materials. Laboratory workers cleaned screen samples with dry natural fiber brushes and damp natural sponges, and sorted the samples into seven broad materials classes: stone tool fragments/debitage, pottery, charcoal/botanical material, historic debris, shell, fish bone, and other bone (mammal and bird). Laboratory workers weighed the material in each class and (where possible) counted individual specimens. I then entered these weights and counts into an Excel spreadsheet to track the relative abundance of faunal material classes within and between proveniences. I used these data to target proveniences with large and variable amounts of faunal material for further study.
I followed four general directives in selecting samples for analysis:
- The faunal material from all samples should represent a broad range of activities related to animal capture and processing.
- The samples should be widely distributed spatially. Originally, I selected samples from several levels in Test Unit 4, with the intention of identfying change in faunal material distribution through time. Since all the samples are roughly contemporaneous, this point is largely moot.
- The samples should be stratigraphically discontinuous, derived from units with different depositional histories, in order to simplify the construction of minimum number of individuals (MNI) data. This will allow me to make the assumption that the remains of a single animal are not distributed among more than one sample.
Following the guidelines above, I selected samples from seven excavation levels for analysis: Levels 6, 14, 18, 20, 24, and 28 from Test Unit 4, and Level 7 from Test Unit 7. Selected sample levels are indicated in the stratigraphic profile maps, Figures 2.2 and 2.4. These samples also bear shorthand laboratory designations (Test Unit/Level): 4/6, 4/14, 4/18, 4/20, 4/28, and 7/7, respectively.
In the second phase of analysis, I attempted to identify to anatomical element and taxonomic category every animal bone or shell fragment from the discretionary sample. The University of Oregon's zooarchaeological comparitive collections lacked certain key species useful for my analyses, including walrus (Odobenus rosmarus), reindeer (Rangifer tarandus) and arctic caribou (Rangifer arcticus), and most of the 89 bird species found on Nunivak Island. To supplement the comparative collection, I employed a variety of literature sources (Cannon 1987; Foster 1991; Gilbert 1973; Smith 1979; Wheeler and Jones 1989) to aid in my identification. In almost all instances, I could utilize these resources to make positive identifications to family, and in many cases to genus. By comparing these results with the range of animals reported in field guides (Burt and Grossenheider 1976; Lamb and Edgell 1986; McConnaughey and McConnaughey 1985; Peterson 1990), I could narrow my identification to the species level in a few instances.
Several anatomical elements proved easier to identify and more information-rich than others. Following Wheeler and Jones (1989:150), I identified certain elements of fish skeletons that preserve well, are easily identified to species, and either occur singly or in pairs. Especially informative fish elements include heavy cranial bones along the medial line (and thus occurring once in a single fish). Some paired elements also proved informative, especially premaxillae, maxillae, and dentaries. Because of extraordinary preservation conditions at Nash Harbor, I could also distinguish elements, such as lightweight bones in the occipital and otic regions, that in other contexts are usually lost to taphonomic factors. Davis (1987:35) noted elements of mammal skeletons providing the same utility, including mandibles, bones of the shoulder and pelvic girdles, and limb and foot bones. The small size of the analyzed mammalian sample limited the number of these indicator bones, and the extent of the comparative collection meant that many bones, especially carpals and tarsals, remain unidentified. Bird remains proved the easiest to identify and often the best preserved. Bird leg, foot, and wing bones, and bones of the sternal and shoulder regions, were especially informative. Analyses at this stage produced number of individual specimens (NISP) data, which reflect the number of bone fragments identified to a particular taxon. In a few instances, I could refit broken bone fragments, but while these refits proved informative for generation of minimum number of indivual data (discussed below), I treated all fragments found at the time of analysis as individual specimens. In other words, if a single bone were found in two fragments, and I refitted those fragments, they still represented NISP = 2.
The next phase of analysis involved the determination of minimum number of individuals (MNI) for each taxonomic group identified above. Minimum numbers provide an estimate of the number of individuals represented in a sample. Using the presence of elements diagnostic of particular taxa—and making some consideration for size and age of the individuals at death—I could derive MNI for all identified taxonomic groups. Except in two instances (the TU4, Level 18 and Level 20 samples, and the Level 24 and Level 28 samples), I regarded each sample unit as discontinuous with other samples, so the MNI for any one species present in a given sample was figured separately from MNI for the same species in other samples.
After identifying remains from excavation samples and computing MNI from those remains, I identified elements from the bulk samples associated with each analyzed unit. Since the volumes of excavated levels and bulk samples varied, and since the bulk samples represented only a tiny fraction of the total soil in any one excavation unit, I could not with any confidence derive meaningful quantitative data from bulk samples. However, the identification of the bones of very small animals in some bulk samples suggested that Nash Harbor residents exploited animals whose remains were not recovered in the 1/4" screen samples.
Since the excavation units providing faunal materials for my analytic sample varied in volume, I studied field notes and maps to estimate the total volume of soil actually excavated in each level. Using these numbers, I computed the Volume Control Constant (KV), to control for variation in excavation volumes. KV represents an excavation level's inverse relationship to the volume of an ideal 10 cm deep excavation level in a 1 m X 1 m excavation unit (.1 m3), and is expressed as:
KV = 0.1/V,
where V is the Excavated Volume of each unit. By multiplying quantitative measures of faunal abundance (e.g. MNI) in a sample with KV, I could directly compare the Minimum Numbers of Individuals (or other measure) for two units, even if they represented samples from units of different excavated volumes. In other words, KV allowed me to pretend that the analyzed faunal samples all derive from ideal 10 cm deep, 1 m X 1 m excavation units.
Faunal Analysis: Problems & Cautions
With small, nonrandom samples recovered using 1 4" screen, from a region largely unexplored archaeologically, there are certain limitations on zooarchaeological analyses discussed in my study.
The analyzed materials are not a random or unbiased sample of the Nash Harbor assemblage. In fact, I chose samples in a decidedly nonrandom fashion, selecting sample units based on sample size and apparent diversity, not for overall representativeness. The analyzed samples represented a tiny fraction of the entire Nash Harbor assemblage, most of which derived from only two midden deposits. The 1/4" mesh used for screening excavated soils led to a bias towards larger animals, or animals with larger remains. I expected that this would lead to an underrepresentation of small fish (e.g. Clupea sp.) and finely pulverized shell fragments, for example. Analysis of faunal material retrieved from bulk soil samples helped correct this bias, at least by indicating that certain species may have been missed. I did not attempt quantitative analyses from bulk samples however, as they are far too small (usually about 2 liters) to represent an entire excavation unit and not uniform in size.
I have already addressed some of the limitations of the University of Oregon comparative collection to my research. While it is a wonderful resource for Northwest Coast archaeologists, it had more limited utility for my studies. I am confident of my identifications at the family level, and in most cases at the genus level. As a result, the broad taxonomic variety of animals (especially birds) found on Nunivak Island is generally underrepresented in my analysis.
Using the arithmetic manipulations described above, I have corrected measures of abundance (bone weight, NISP, and MNI) for variations in the volumes of excavated units. However, these manipulations do not accurately represent a predictable change, since the number of taxa present in a sample varies as a function of NISP or MNI. That is, as the actual number of specimens or individuals rises, the taxonomic richness of a sample should also rise (Davis 1987;Grayson 1981). I will address this difficulty in greater detail in Section 5. Arithmetic manipulations also produced non-integral numbers for measures that are actually counts of individuals (specimens or animals). This leads, for example, to nonsensical measures like "1.8 Microgadus individuals" or "0.6 individual Odobenus bones." These fractions do not represent the observation of fractions of individuals, but rather the number of individual bones or animals per 0.1 m3 of excavated soil. I have avoided rounding corrected measures to the nearest whole number, since this would add a decimal place of uncertainty to my analyses.
Many of my analyses depend on the distribution of faunal remains represented by minimum numbers of individuals. Davis (1987:35–36) questioned the utility of MNI as a measure of abundance between mammalian taxa, although his apprehensiveness concerned comparisons of MNI in large assemblages, subjected to more statistical manipulation than the small Nash Harbor assemblage. Wheeler and Jones (1989: 149) also expressed reservations about using MNI to rank fish remains at a site. Grayson (1981) noted that quantitative faunal data are largely dependent on sample size, an imporant caveat given the small size of the Nash Harbor sample for all taxonomic groups other than fish. Hesse and Wapnish (1985: 114) addressed the spatial distribution of elements in determining MNI; they wondered how far apart two elements must be—horizontally or vertically—before they can be considered as deriving from two individuals. Ultimately, I sided with Grayson (1973) in acknowledging the shortcomings of MNI and other derived data, and utilized them to construct indices of ordinal, rather than absolute, abundance. That is, I could say that certain species were more abundant than others, but could not address how much more important.
Finally, my research pioneers new ground zooarchaeologically. Archaeological data for the entire Yukon-Kuskokwim delta region are generally sparse; except for Chatters’ (1972) brief report, zooarchaeological data were nonexistent. Without baseline data, I can not advance or test hypotheses based on the work of previous archaeologists. Conversely, I expect that many of my results will serve as targets for attack by future, more savvy researchers.
4: Review of Results by Sample Unit
From the nonrandom, discretionary samples described in the preceding section, I analyzed 3739 individual fish, bird, and mammal specimens; these and the invertebrate remains weighed 4344 g in total (Table 4.1). I identified 2388 specimens; much of the remaining material consisted of undifferentiated bone, heavily altered by perthotaxic (post-death and pre-burial) and anataxic (post-burial) taphonomic factors (Lyman, 1994: 354–416). This was especially the case for mammal bones, which contained a preponderance of pulverized, crushed, burned, and eroded specimens.
| NISP | MNI | Wt. (g) | |
|---|---|---|---|
| Birds | |||
| Identified | 204 | 47 | 151.5 |
| Unidentified | 94 | n/a | 30.6 |
| Total | 298 | 47 | 182 |
| % Identified | 68.5 | n/a | 83.2 |
| Fish | |||
| Number Identified | 1810 | 68 | 1209.3 |
| Not Identified | 905 | n/a | 256.3 |
| Total | 2715 | 68 | 1465.6 |
| % Identified | 66.7 | n/a | 82.5 |
| Mammals | |||
| Number Identified | 374 | 30 | 2153.7 |
| Not Identified | 352 | n/a | 255.7 |
| Total | 726 | 30 | 2409.5 |
| % Identified | 51.1 | n/a | 89.5 |
| Invertebrates | |||
| Total | n/a | 37 | 286.9 |
| All Material | |||
| Total Identified | 2388 | 182 | 3801.4 |
| Grand Total | 3739 | 182 | 4344.1 |
| % Identified | 63.9 | n/a | 87.5 |
Table 4.1, Summary of Analyzed Faunal Remains from Selected Samples.
From the 2388 identified specimens, I noted at least 45 taxa: Twelve genera in six bird families, six genera in five fish families, and ten genera in eight mammal families. I also noted two bivalve genera, and at least one variety each of marine snail and barnacle. Table 4.2 summarizes taxa present in the analyzed samples.
| Sample (Test Unit/Level) | ||||||||
|---|---|---|---|---|---|---|---|---|
| Latin Name | Common Name | 4/6 | 4/14 | 4/18 | 4/20 | 4/24 | 4/28 | 7/7 |
| Aves | Birds | Y | Y | Y | Y | Y | Y | |
| Alcidae | auks, etc. | Y | Y | Y | Y | Y | ||
| Brachyramphus sp. | murrelets | Y | ||||||
| Cepphus columba | pigeon guillemot | Y | Y | Y | Y | |||
| Cerorhinca monocerata | rhinoceros auklet | Y | ||||||
| Uria sp. | murres | Y | Y | Y | Y | Y | ||
| Anatidae | ducks, geese, etc. | Y | Y | Y | Y | |||
| Anas sp. | marsh ducks | Y | ||||||
| Bucephala sp. | buffleheads & goldeneyes | Y | ||||||
| Melanitta sp. | scoters or sea ducks | Y | ||||||
| Gaviidae | loons | Y | Y | Y | ||||
| Gavia arctica? | loons (arctic loon) | Y | Y | Y | ||||
| Laridae | gulls, skuas, & terns | Y | Y | Y | Y | Y | Y | |
| Larus sp. | sea gulls | Y | Y | Y | Y | |||
| Rissa sp. | kittiwakes | Y | Y | Y | Y | Y | ||
| Podicipedidae | grebes | Y | Y | |||||
| Aechmorphus occidentalis | western grebe | Y | ||||||
| Phalacrocoracidae | cormorants | Y | Y | |||||
| Phalacrocorax sp. | cormorant | Y | Y | |||||
| Pisces | Fish | Y | Y | Y | Y | Y | Y | Y |
| Clupeidae | herring | Y | ||||||
| Clupea harengus | Pacific herring | Y | ||||||
| Gadidae | cod | Y | Y | Y | Y | Y | Y | |
| Gadus macrocephalus | Pacific cod | Y | Y | Y | Y | Y | Y | |
| Microgadus proximus | Pacific tomcod | ? | ||||||
| Pleuronectidae | flatfish | Y | ? | |||||
| Salmonidae | salmon & trout | Y | Y | Y | Y | Y | Y | |
| Scorpaenidae | rockfish | Y | Y | Y | Y | Y | ||
| Mammalia | Mammals | Y | Y | Y | Y | Y | Y | Y |
| Canidae | dogs, etc. | Y | Y | Y | Y | |||
| Canis familiaris | domestic dog | Y | ? | |||||
| Canis lupus | wolf | ? | ||||||
| Vulpes sp. | foxes | Y | ||||||
| Cervidae | deer, caribou & moose | Y | Y | Y | ||||
| Rangifer sp. | caribou & reindeer | Y | Y | Y | ||||
| Cetacea | whales & dolphins | Y | Y | |||||
| Cricetidae | mice, rats, etc. | Y | Y | Y | ||||
| Synaptomys | lemming | Y | Y | Y | ||||
| Mustelidae | weasels, skunks, etc. | Y | ||||||
| Odobenidae | walrus | Y | Y | Y | Y | |||
| Odobenus rosmarus | walrus | Y | Y | Y | Y | |||
| Otariidae | sea lions & fur seals | Y | Y | Y | ||||
| Phocidae | hair seals & elephant seals | Y | Y | Y | Y | Y | ||
| Mollusca & Arthropoda | Mollusks & Arthropods | Y | Y | Y | Y | Y | ||
| Mollusca—Bivalva | bivalves | Y | Y | Y | Y | Y | ||
| Macoma sp. | chalky clams | Y | Y | Y | ||||
| Mytilus edulis | blue mussel | Y | Y | Y | Y | Y | ||
| Mollusca—Gastropoda | snails | Y | Y | |||||
| Arthropoda—Balanus sp. | barnacles | Y | Y | |||||
Table 4.2, Summary of taxa identified, by sample provenience. Ys signify presence of taxa indicated. Indication of presence for familly and higher-order taxa includes individuals identified to genus or species, and individuals not identified to genus or species.
Unless otherwise noted, all specimens referred to in the following section were recovered in 1/4" screen samples. I occasionally employed data derived from analyses of specimens recovered from bulk samples with an 1/8" screen in the laboratory. I also paired my summaries of quantitative data with arithmetic manipulations of those data to control for variations in the volume of soil excavated in each unit. I calculated volume-controlled data by multiplying a given measure (NISP, MNI, or bone/shell weight) by the Volume Control Constant (KV) for the unit from which the data derive, as described in Section 3. While I will present volume-adjusted data alongside raw data in Section 4, I will discuss the implications of adjusted data in Section 5.
Test Unit 4, Level 6 (Sample 4/6)
The faunal sample from Test Unit 4, Level 6 (TU4, Level 6) derived from Stratum I (A/O horizon) soils. Active biological processes and the excavation level's proximity to the surface complicated the interpretation of faunal remains from this sample in two significant ways. First, root penetration and rodent activity in this stratum obscured depositional boundaries—if they actually existed—that might indicate separate occupation or activity episodes. Second, these same soil formation factors accelerated decay of the faunal materials, especially when compared to samples lower in the unit where permafrost in essence refrigerated archaeological materials.
Unlike excavation levels beneath it in Test Unit 4, the excavation of level 6 was relatively uncomplicated. I excavated from the cutbank edge south to the nearest east-west 1m grid line, resulting in an excavation level more than 0.1 m3 in volume. By computing the volume from field notes and maps, I estimate the level’s volume to be 0.12 m3, and its volume control constant to be KV = 0.83.
Of the 98 bird specimens weighing a total of 39.4 g, I identified 56 specimens totaling 31.1 g to taxon and anatomical element. At least 15 individual birds, representing at least eight species in four families, were present in the sample (Table 4.3). Most abundant were anatids (ducks, geese, and swans), with the remains of at least 2 individuals of the genus Anas (marsh ducks), and at least 3 individuals of other, unidentified genera.
| Actual Values | Adjusted for Volume | |||||
| Taxon | NISP | MNI | Wt. (g) | NISP | MNI | Wt. (g) |
|---|---|---|---|---|---|---|
| Alcidae | 3 | 1 | 0.8 | 2.5 | 0.8 | 0.7 |
| Anas sp. | 7 | 2 | 5.4 | 5.8 | 1.7 | 4.5 |
| Anatidae | 6 | 3 | 3.9 | 5.0 | 2.5 | 3.2 |
| Anatidae or Alcidae | 24 | n/a | 8.4 | 19.9 | n/a | 7.0 |
| Cepphus columba | 1 | 1 | 0.4 | 0.8 | 0.8 | 0.3 |
| Gavia sp. | 1 | 1 | 2.5 | 0.8 | 0.8 | 2.1 |
| Larus sp. | 4 | 1 | 4.4 | 3.3 | 0.8 | 3.7 |
| Rissa sp. | 3 | 2 | 2.7 | 2.5 | 1.7 | 2.2 |
| Uria (aalge?) | 7 | 1 | 2.8 | 5.8 | 0.8 | 2.3 |
| Unidentified | 42 | n/a | 8.2 | 34.9 | n/a | 6.8 |
| Birds Total | 98 | 12 | 39.5 | 81.3 | 10 | 32.8 |
Table 4.3, Analyzed Bird Remains from TU4, Level 6. Righthand columns indicate measures adjusted for excavation volume (KV=0.83).
Members of the auk family (Alcidae) were also well-represented, with the remains of at least 3 individuals—one each of the genera Cepphus (guillemots) and Uria (murres, probably Uria aalge, the common murre), and one individual of an unidentified genus. I also identified the remains of three individuals of the gull family (Laridae)—one sea gull (Larus sp.) and two kittiwakes (Rissa sp.)—and one individual of the loon family (Gavia sp.). 24 bones lacking articular or other easily recognizable surfaces were of similar size to small anatid or alcid bones in the comparative collection, and could not be identified, along with 42 specimens of undifferentiated (usually crushed and burned) bone.
| Actual Values | Adjusted for Volume | |||||
| Taxon | NISP | MNI | Wt. (g) | NISP | MNI | Wt. (g) |
|---|---|---|---|---|---|---|
| Gadus macrocephalus | 253 | 7 | 240.6 | 210.0 | 5.8 | 199.7 |
| Pleuronectidae | 4 | 1 | 3.4 | 3.3 | 0.8 | 2.8 |
| Salmonidae | 8 | 1 | 2.7 | 6.6 | 0.8 | 2.2 |
| Scorpaenidae | 27 | 2 | 10.9 | 22.4 | 1.7 | 9.0 |
| Unidentified, but not Gadidae | 67 | 3 | 20.1 | 55.6 | 2.5 | 16.7 |
| Unidentified, prob. Gadus | 85 | n/a | 55.5 | 70.6 | n/a | 46.1 |
| Unidentified | 155 | n/a | 39.6 | 128.7 | n/a | 32.9 |
| Fish Total | 599 | 7 | 372.8 | 497.2 | 5.8 | 309.4 |
Table 4.4, Analyzed Fish Remains from TU4, Level 6. Righthand columns indicate measures adjusted for excavation volume (KV=0.83).
I recovered and analyzed 599 fish bones from TU4, level 6, weighing 372.8 g; of these I identified 324 specimens, weighing a total of 268.3 g and representing at least 14 individual fish (Table 4.4). Gadus macrocephalus were the most abundant fish in this sample, with the remains of at least seven individuals represented by more than 250 specimens. Next most abundant were rockfish (Scorpaenidae, probably Sebastes sp.), with two individuals represented by 27 specimens. Flatfish (Pleuronectidae) and salmonids (Salmonidae) were also each represented by the remains of at least one individual of each family.
| Actual Values | Adjusted for Volume | |||||
| Taxon | NISP | MNI | Wt. (g) | NISP | MNI | Wt. (g) |
|---|---|---|---|---|---|---|
| Canidae, probably Vulpes sp. | 3 | 1 | 251 | 2.5 | 0.8 | 208.3 |
| Phocidae | 12 | 1 | 101.3 | 10 | 0.8 | 84.1 |
| Mustelidae | 1 | 1 | 1 | 0.8 | 0.8 | 0.8 |
| Odobenus rosmarus | 10 | 1 | 480.7 | 8.3 | 0.8 | 399 |
| Rangifer sp. | 1 | 1 | 1.1 | 0.8 | 0.8 | 0.9 |
| Cricetidae, prob. Synaptomys/Dicrostonyx | 4 | 1 | 0.7 | 3.3 | 0.8 | 0.6 |
| Undifferentiated/poss. Rangifer | 1 | n/a | 5.3 | 0.8 | n/a | 4.4 |
| Undifferentiated, poss. Canis or Phocidae | 71 | n/a | 65.7 | 58.9 | n/a | 54.5 |
| Unidentified, small mammal | 24 | n/a | 10.9 | 19.9 | n/a | 9.0 |
| Unidentified | 154 | n/a | 121 | 127.8 | n/a | 100.4 |
| Mammal Total | 281 | 6 | 1038.7 | 233.2 | 5.0 | 862.1 |
Table 4.5, Analyzed Mammal Remains from TU4, Level 6. Righthand columns indicate measures adjusted for excavation volume (KV=0.83).
281 specimens comprised the mammalian faunal sample in TU4, Level 6. I identified 127 specimens, representing six individuals in 6 families (Table 4.5). The mammal remains from TU4, Level 6 were particularly poorly-preserved. Many of these showed evidence of having been burned, crushed, or pulverized; even large intact specimens were badly eroded. Phocids and Rangifer (caribou or reindeer) were the most abundant taxa by bone weight and number of individual specimens. Phocids were represented by 12 specimens connoting at least one juvenile individual. Odobenus rosmarus was represented by ten specimens--six rib fragments and four pieces of ivory, all of which show evidence of shaping for use as tools. I identified a wide variety of other mammal remains: a small canid’s (probably Vulpes sp.) teeth, a single Rangifer molar, and a burned Mustelidae (weasel or mink) humerus. A long bone fragment and paired mandibles represents a single rodent, probably a lemming (Synaptomys sp. or Dicrostonyx sp.). This rodent may have been intrusive, a strong possibility given the turbated nature of the soil.
| Actual Values | Adjusted for Volume | |||||
| Taxon | NISP | MNI | Wt. (g) | NISP | MNI | Wt. (g) |
|---|---|---|---|---|---|---|
| Gastropoda | 13 | 4 | 0.7 | 10.8 | 3.3 | 0.6 |
| Macoma sp. | 53 | 4 | 37.3 | 44.0 | 3.3 | 31.0 |
| Mytilus edulis | n/a | 1 | 17.1 | n/a | 0.8 | 14.2 |
| Invertebrate/Total | 66 | 9 | 55.1 | 54.8 | 7.5 | 45.7 |
Table 4.6, Identified invertebrate remains from TU4, Level 6. Righthand columns indicate measures adjusted for excavation volume (KV=0.83).
Several shell fragments indicated the presence of mollusks in the TU4, Level 6, sample. Unlike other samples with significant amounts of shellfish remains, the most abundant species was not Mytilus edulis (blue mussel) but a variety of clam, probably Macoma. This bivalve was represented by 53 large fragments weighing a total of 37.3 g, more than twice the total weight of the highly fragmentary Mytilus sample of 17 g (Table 4.6). Eight partial Macoma hinge fragments also suggested the presence of at least four individual clams. Mytilus remains may have been underrepresented due to excavation and screening methods, but the Macoma remains from this sample still outweighed all other non-Mytilus shellfish remains from other analyzed samples.
Test Unit 4, Level 14 (Sample 4/14)
The southern margin of this unit had frozen solid, but the northern margin along the sea cliff edge had thawed some 50 cm back from the exposure, making excavation possible in the northern half of the excavation unit. As a result of this and the ragged north edge of the unit due to erosion along the bank, the excavation unit had a non-standard shape and volume. By analyzing excavation plan maps and profile maps, I estimate the total volume of TU4, Level 14 at 0.06 m3, yielding a Volume Control Constant of KV = 1.6.
Although difficult to excavate because of its hard, concrete-like consistency, permafrost helped preserve archaeological materials in this unit. The frozen matrix minimized root penetration, rodent burrowing, and microorganism activity, so strata were reasonably intact, and archaeological materials were well preserved. I located several concentrations of fish and bird bone that probably denoted discrete dumping locations. Excavation Level 14 contained a large proportion of the midden material above Feature 1, in Stratum II-9. Moderately sticky, silty sandy loams with high organic content characterized the Stratum II soils of Level 14. Several substrata intersected the excavation level, each of which may have represented unique depositional processes. For the purposes of my analyses, however, I assumed that the midden materials in substratum II-9 represented a single activity locus.
| Actual Values | Adjusted for Volume | |||||
| Taxon | NISP | MNI | Wt. (g) | NISP | MNI | Wt. (g) |
|---|---|---|---|---|---|---|
| Alcidae, Misc. | 5 | 1 | 2.2 | 8 | 1.6 | 3.5 |
| Histrionicus histrionicus | 2 | 1 | 1.4 | 3.2 | 1.6 | 2.2 |
| Larus sp. | 3 | 2 | 11.4 | 4.8 | 3.2 | 18.2 |
| Rissa sp. | 5 | 2 | 2.6 | 8 | 3.2 | 4.2 |
| Uria (aalge?) | 2 | 1 | 0.8 | 3.2 | 1.6 | 1.3 |
| Unidentified/Gull Size | 3 | n/a | 2.9 | 4.8 | n/a | 4.6 |
| Unidentified/Small, poss. Alcidae | 13 | 0 | 6.8 | 20.8 | 0 | 10.9 |
| Bird Total | 33 | 7 | 28.1 | 52.8 | 11.2 | 45 |
Table 4.7, Analyzed Bird Remains from TU4, Level 14. Righthand columns indicate measures adjusted for excavation volume (KV=1.6).
I recovered 33 bird bones weighing 28 g, signifying at least seven individuals in five taxa, of which larids may have been the most numerous (Table 4.7). Two individual sea gulls (Larus sp.) were represented by three specimens, two of which were complete left humeri. Five specimens --including two left carpometacarpi--indicated a minimum of two Rissa individuals. Three other specimens suggested another gull-size bird, although these were too badly eroded to make firm identification possible. A single anatid (possibly a harlequin duck, Histrionicus histrionicus) was represented by two specimens. Murres were present as well, with at least one Uria and one unidentified alcid indicated by 5 specimens. 13 other bones, badly deteriorated but similar in size to Alcidae specimens in the comparative collection, implied that Alcidae may have been even more abundant than MNI counts suggest.
| Actual Values | Adjusted for Volume | |||||
| Taxon | NISP | MNI | Wt. (g) | NISP | MNI | Wt. (g) |
|---|---|---|---|---|---|---|
| Gadus macrocephalus | 618 | 19 | 539.7 | 988.8 | 30.4 | 863.5 |
| Salmonidae | 12 | 1 | 0.8 | 19.2 | 1.6 | 1.3 |
| Scorpaenidae | 8 | 1 | 1 | 12.8 | 1.6 | 1.6 |
| Undifferentiated; Gadus macrocephalus? | 550 | n/a | 113 | 880 | n/a | 180.8 |
| Undifferentiated, but not Gadus | 6 | n/a | 0.6 | 9.6 | n/a | 1.0 |
| Unidentified | 238 | n/a | 66 | 380.8 | n/a | 105.6 |
| Fish Total | 1432 | 2 | 721.1 | 2291.2 | 3.2 | 1153.8 |
Table 4.8, Analyzed Fish Remains from TU4, Level 14. Righthand columns indicate measures adjusted for excavation volume (KV=1.6).
By any measure (MNI, NISP, or bone weight), fish remains—especially Pacific cod (Gadus macrocephalus)—overwhelmed the other fauna in the TU4, Level 14 sample (Table 4.8). As in other samples, Pacific cod was the most abundant fish, with at least 19 individuals represented by more than 618 specimens. 19 atlas vertebrae indicated a minimum of 19 cod; other elements (10 frontal bones; 13 left exoccipitals, 17 basioccipitals) supported the high Gadus macrocephalus MNI based on cranial elements. A few other fish were represented in the sample as well—twelve vertebrae indicated at least one salmonid, and eight vertebrae indicated a single scorpaenid. 550 elements weighing 113 g had the consistency of other, identified Gadus bones, but were crushed and not easily differentiated as to element. Six specimens possibly do not belong to Gadus, but were also undifferentiated bone fragments.
| Actual Values | Adjusted for Volume | |||||
| Taxon | NISP | MNI | Wt. (g) | NISP | MNI | Wt. (g) |
|---|---|---|---|---|---|---|
| Canis Familiarus | 9 | 1 | 5 | 14.4 | 1.6 | 8.0 |
| Cetacea | 2 | 1 | 142.3 | 3.2 | 1.6 | 227.7 |
| Odobenus rosmarus | 2 | 1 | 37.5 | 3.2 | 1.6 | 60.0 |
| Phocidae | 4 | 1 | 56.7 | 6.4 | 1.6 | 90.7 |
| Otariidae | 1 | 1 | 57.8 | 1.6 | 1.6 | 92.5 |
| Synaptomys or Dicrostonyx | 4 | 4 | 0.6 | 6.4 | 6.4 | 1.0 |
| Unidentified/Dog Size | 31 | n/a | 1.7 | 49.6 | n/a | 2.7 |
| Unidentified/Large Marine Mammal | 2 | n/a | 5.2 | 3.2 | n/a | 8.3 |
| Unidentified/Small Mammal | 29 | n/a | 15.3 | 46.4 | n/a | 24.5 |
| Unidentified | 86 | n/a | 55.2 | 137.6 | n/a | 88.3 |
| Mammal/Total | 170 | 9 | 377.3 | 272 | 14.4 | 603.7 |
Table 4.9, Analyzed Mammal Remains from TU4, Level 14. Righthand columns indicate measures adjusted for excavation volume (KV=1.6).
I recovered and analyzed a wide variety of mammal bones from TU4, Level 14—approximately 170 specimens representing at least nine individuals in six taxa, and weighing a total of 378 g (Table 4.9). Dog remains—probably Canis familiaris, the domestic dog—figure prominently in the identified sample, with nine identified specimens. A small phocid is also present, with four elements representing a single individual. I also noted 31 bones—ribs, and fragments of carpals and tarsals—of the appropriate size to belong either to a large dog or small phocid, so these taxa may be underrepresented in Table 4.9. I also identified 2 long bone fragments of a porous consistency similar to sea mammal bones in the comparative collection. Other sea mammal remains were present in this sample—at least one walrus and one sea lion. Two large fragments of porous bone signified the remains of a single cetacean. Four tiny left mandibles indicated the presence—probably intrusive—of lemmings of the genera Synaptomys or Discrostonyx.
| Actual Values | Adjusted for Volume | |||||
| Taxon | NISP | MNI | Wt. (g) | NISP | MNI | Wt. (g) |
|---|---|---|---|---|---|---|
| Macoma sp. | 1 | 1 | 1.1 | 1.6 | 1.6 | 1.8 |
| Mytilus sp. | 5+ | 3 | 38.9 | 5+ | 4.8 | 62.2 |
| Invertebrate Total | n/a | 4 | 40 | n/a | 6.4 | 64.0 |
Table 4.10, Analyzed Invertebrate Remains from TU4, Level 14. Righthand columns indicate measures adjusted for excavation volume (KV=1.6).
The excavation crew recovered a few invertebrate remains from TU4, Level 14, during excavation. Most were badly crushed shell fragments or pieces of periostracum, the leathery "skin" covering mussels shells; altogether they weighed 40 g (Table 4.10). Five Mytilus hinge fragments—three right and two left—indicated the presence of at least three individual mussels, weighing a total of 38.9 g. I also noted a single fragment of Macoma shell.
Test Unit 4, Level 18 (Sample 4/18)
TU4, Level 18, lay under the large rock feature, Feature 1. During excavation, and until the return of radiocarbon dates from TU4, I assumed that Feature 1 represented a distinct stratigraphic boundary, separating Stratum II and Stratum III soils, as described in Section 3. Level 18 (and the stratigraphically similar Level 20) yielded significant amounts of animal bone, especially considering their volume. The Level 18 sample (and the Level 20 sample, to be discussed later) contained no shellfish remains.
Owing to the refrigerative properties of permafrost, Level 18 was largely unimpacted by bioturbation, decay, and soil formation processes, and it did not appear to intersect dense regions of refuse, as with Level 14. Substrata soils vary widely, from sticky anthropic sandy silt loams to thin sheets of sands, perhaps eolian in origin. I have interpreted the variety of soil types here as evidence of turbation during or immediately after deposition, perhaps as a result of episodes of trash dumping, interspersed with episodes of eolian sand deposition.
Excavation of Level 18 was constrained by the large stones of Feature 1, which could not be removed without risking damage to the excavation walls. The excavation crew worked from the cut bank face south, in essence digging into the level sideways. We also left a large cantilevered pedestal to support the weight of Feature 1. These two conditions produced an excavation level considerably smaller than the ideal 0.1 m3; my calculations placed the volume of Level 18 at around 0.05 m3, with a Volume Control Constant of 2.0.
| Actual Values | Adjusted for Volume | |||||
| Taxon | NISP | MNI | Wt. (g) | NISP | MNI | Wt. (g) |
|---|---|---|---|---|---|---|
| Alcidae, very small | 5 | 2 | 1.8 | 10 | 4 | 3.6 |
| prob. Anas sp. | 1 | 1 | 0.8 | 2 | 2 | 1.6 |
| Other Anatidae | 2 | 1 | 0.8 | 4 | 2 | 1.6 |
| Bucephala sp. | 3 | 1 | 1.2 | 6 | 2 | 2.4 |
| Cepphus columba | 3 | 2 | 0.7 | 6 | 4 | 1.4 |
| Cerorhinca sp. | 3 | 1 | 1.3 | 6 | 2 | 2.6 |
| Larus sp. | 3 | 1 | 1.8 | 6 | 2 | 3.6 |
| prob. Melanitta sp. | 1 | 1 | 2.2 | 2 | 2 | 4.4 |
| Uria sp. | 4 | 1 | 3.4 | 8 | 2 | 6.8 |
| Unidentified/Small Anatidae? | 8 | n/a | 3.9 | 16 | n/a | 7.8 |
| Unidentified/Laridae? | 2 | n/a | 1.7 | 4 | n/a | 3.4 |
| Not Identified/Misc. | 19 | n/a | 7.2 | 38 | n/a | 14.4 |
| Bird/Total | 54 | 11 | 26.8 | 108 | 22 | 53.6 |
Table 4.11, Analyzed Bird Remains from TU4, Level 18. Righthand columns indicate measures adjusted for excavation volume (KV=2).
Of the 54 total bird specimens from the TU4, Level 18 sample, I identified 35 specimens (Table 4.11). Alcids seemed particularly abundant in the Level 18 sample, represented by two Cepphus individuals, one Cerorhinca individual, one Uria individual (probably aalge), and two unidentified Alcidae. I noted the remains of at least four anatid individuals—one each Anas, Bucephala, and Melanitta, and an unidentified small anatid. In addition, I noted eight specimens with similarities to anatids in the comparative collection. Larids were poorly represented, with only a single individual of Larus indicated by three elements; two other elements identified to Lariidae suggested the presence of a second larid.
| Actual Values | Adjusted for Volume | |||||
| Taxon | NISP | MNI | Wt. (g) | NISP | MNI | Wt. (g) |
|---|---|---|---|---|---|---|
| Gadus macrocephalus | 185 | 4 | 186.4 | 370 | 8 | 372.8 |
| Salmonidae | 7 | 1 | 1.2 | 14 | 2 | 2.4 |
| Not Identified/poss. Gadidae | 240 | n/a | 59.8 | 480 | n/a | 119.6 |
| Fish Total (from 1/4" screen sample) | 432 | 5 | 247.4 | 864 | 10 | 494.8 |
| Clupea harengus (from bulk sample) | 150 | 3 | 1.1 | n/a | n/a | n/a |
Table 4.12, Analyzed Fish Remains from TU4, Level 18.
The fish bone sample from TU4, Level 18, consisted of 432 specimens weighing a total of 247 g (Table 4.12). I found the remains of at least four gadids. In addition to cod remains from the TU4, Level 18 sample, I found seven vertebrae indicating the presence of at least one salmonid individual.
Analysis of bulk sample materials recovered in the laboratory using 1 8" screens revealed the presence of a large number of Clupea bones in the 4/18 sample. I noted 149 Clupea harengus vertebrae and one basioccipital; together, these bones weighed a mere 1.1 g and represented three individuals. Since bulk samples varied wildly in volume and represent a tiny fraction of the total excavated volume, I could not extrapolate the overall abundance of Clupea in TU4, Level 18. However, excavators will have missed virtually all of the tiny Clupea remains, whatever their abundance, and herring played some role in the economy of Nash Harbor people.
| Actual Values | Adjusted for Volume | |||||
| Taxon | NISP | MNI | Wt. (g) | NISP | MNI | Wt. (g) |
|---|---|---|---|---|---|---|
| Canis familiarus | 19 | 1 | 48 | 38 | 2 | 96 |
| Phocidae | 30 | 2 | 38 | 60 | 4 | 76 |
| Unidentified/Marine Mammal | 1 | n/a | 22.5 | 2 | n/a | 45 |
| Unidentified | 40 | n/a | 29.6 | 80 | n/a | 59.2 |
| Mammal Total | 90 | 3 | 138.1 | 180 | 6 | 276.2 |
Table 4.13, Analyzed Mammal Remains from TU4, Level 18. Righthand columns indicate measures adjusted for excavation volume (KV=2).
Ninety specimens totaling 138 g comprised the sample of analyzed mammal remains from TU4, Level 18 (Table 4.13). Forty or so of these specimens were burned or otherwise damaged, possibly before deposition. Many of these were also small, difficult to identify bones—carpals and tarsals. Of the remaining specimens, 30 appeared to belong to two phocid individuals, one of them juvenile. A single large bone may also have belonged to a large marine mammal. In addition, 19 elements, mostly ribs and a humerus and femur, signified the presence of at least one medium size canid, probably Canis familiaris.
Test Unit 4, Level 20 (Sample 4/20)
The soils of Test Unit 4, Level 20, were similar to those of Level 18. Mixed anthropic soils, consisting of dark brown, slightly sticky silty loam, were interspersed with lenses of tan to gray sands showing a degree of rounding, characteristic of probable eolian beach sands.
Excavation in Level 20 proceeded more smoothly than in Level 18, although Feature 1 again forced us to excavate this unit from the cut bank into the dune. I estimated the volume of Level 20 to be 0.07 m3. Dividing the ideal excavation unit volume of 0.1 m3 by the actual volume excavated yielded a Volume Control Constant of 1.43.
| Actual Values | Adjusted for Volume | |||||
| Taxon | NISP | MNI | Wt. (g) | NISP | MNI | Wt. (g) |
|---|---|---|---|---|---|---|
| Aechmorphus occidentalis | 1 | 1 | 0.5 | 1.4 | 1.4 | 0.7 |
| Alcidae | 2 | 1 | 0.4 | 2.9 | 1.4 | 0.6 |
| Brachyramphus sp. | 1 | 1 | 0.5 | 1.4 | 1.4 | 0.7 |
| Cepphus columba | 2 | 1 | 0.7 | 2.9 | 1.4 | 1 |
| Gavia sp. | 1 | 1 | 1 | 1.4 | 1.4 | 1.4 |
| Phalacrocorax sp. | 2 | 1 | 3.2 | 2.9 | 1.4 | 4.6 |
| Rissa sp. | 2 | 1 | 1 | 2.9 | 1.4 | 1.4 |
| Uria sp., poss. aalge | 3 | 1 | 6.2 | 4.3 | 1.4 | 8.9 |
| Unidentified | 8 | n/a | 3.6 | 11.4 | n/a | 5.1 |
| Bird Total | 22 | 8 | 17.1 | 31.5 | 11.4 | 24.5 |
Table 4.14, Analyzed Bird Remains from TU4, Level 20. Righthand columns indicate measures adjusted for excavation volume (KV=1.43).
Of the 22 bird bones from the TU4, Level 20 sample, I identified 14 to taxon (Table 4.14). Cliff-dwelling birds dominated the identified sample, with at least one individual each of murrelets (Brachyramphus sp.), Cepphus columba, Uria sp. (probably aalge), and one other alcid. I also noted a single cormorant and one kittiwake individual. Anatids were entirely absent from the sample, but a single grebe (Aechmorphus occidentalis) and one loon were present.
| Actual Values | Adjusted for Volume | |||||
| Taxon | NISP | MNI | Wt. (g) | NISP | MNI | Wt. (g) |
|---|---|---|---|---|---|---|
| Gadus macrocephalus | 74 | 2 | 47 | 105.8 | 2.9 | 67.2 |
| Salmonidae | 3 | 1 | 0.6 | 4.3 | 1.4 | 0.9 |
| Sebastes sp. | 5 | 1 | 0.8 | 7.2 | 1.4 | 1.1 |
| Unidentified, but not Gadus macrocephalus | 4 | n/a | 1 | 5.7 | n/a | 1.4 |
| Unidentified, prob. Gadidae | 30 | n/a | 5.7 | 42.9 | n/a | 8.2 |
| Unidentified | 100 | n/a | 11.1 | 143 | n/a | 15.9 |
| Fish/Total | 216 | 4 | 66.2 | 308.9 | 5.7 | 94.7 |
Table 4.15, Analyzed fish remains from TU4, Level 20. Righthand columns indicate measures adjusted for excavation volume (KV=1.43).
Fish were represented in the TU4, Level 20, sample by 216 specimens weighing 66.2 g. Gadus macrocephalus again dominated the sample, but I identified a minimum of only two individuals, indicated by 74 elements. Salmonids and scorpaenids were also represented by one individual each. Four elements could not be identified to taxa, but were unlike gadid bones in consistency, implying that the sample may have contained the remains of at least one other non-gadid fish.
| Actual Values | Adjusted for Volume | |||||
| Taxon | NISP | MNI | Wt. (g) | NISP | MNI | Wt. (g) |
|---|---|---|---|---|---|---|
| Canis lupus | 2 | 1 | 44.2 | 2.9 | 1.4 | 63.2 |
| Odobenus rosmarus | 2 | 1 | 152 | 2.9 | 1.4 | 217.4 |
| Otariidae | 1 | 1 | 13.7 | 1.4 | 1.4 | 19.6 |
| Phocidae | 15 | 1 | 38.5 | 21.5 | 1.4 | 55.1 |
| Rangifer sp. | 3 | 1 | 76.6 | 4.3 | 1.4 | 109.5 |
| Unidentified, Pinniped? | 4 | n/a | 24.7 | 5.7 | n/a | 35.3 |
| Unidentified, marine mammal? | 7 | n/a | 9.8 | 10 | n/a | 14.0 |
| Unidentified, Rangifer? | 9 | n/a | 54.8 | 12.9 | n/a | 78.4 |
| Unidentified, Phocidae? | 6 | n/a | 12.2 | 8.6 | n/a | 17.4 |
| Unidentified, Canidae or Phocidae? | 49 | n/a | 23.4 | 70.1 | n/a | 33.5 |
| Mammal/Total | 98 | 5 | 449.9 | 140.1 | 7.2 | 643.4 |
Table 4.16, Analyzed Mammal Remains from TU4, Level 20. Righthand columns indicate measures adjusted for excavation volume (KV=1.43).
Ninety-eight individual specimens weighing 449.9 g comprised the mammalian sample from TU4, Level 20 (Table 4.16). Large mammals predominated, with at least one individual each of Phocidae, Canidae (probably Canis lupus), Odobenus rosmarus, and Rangifer. A large number of partially-identified elements implied that mammals may have been more abundant in this level than indicated by MNI. Forty-nine fragmentary long bone, vertebral, and rib elements were similar to small phocid or large canid bones in the comparative collection. Long bone fragments suggested larger mammals—caribou, sea lion, or other, unidentified mammals.
Test Unit 4, Level 24 (Sample 4/24)
TU4, Level 24, intersected two major strata of markedly different histories and consistencies. Stratum IV indicated the lowest and earliest anthropic soils in Test Unit 4; dark gray to brown sandy loams with dense pockets of vegetal organic matter characterized these soils. Stratum V indicated sterile parent soils; these were gray beach sands, containing no cultural materials.
The crew experienced no particular difficulty in excavating Level 24. Permafrost proved a problem in the southern margin of the unit, but the loose sandy matrix meant that the cold soil thawed quickly and was easily excavated even when partially thawed. The estimated volume of TU4, Level 24, is about 0.06 m3, with a Volume Control Constant of 1.6.
| Actual Values | Adjusted for Volume | |||||
| Taxon | NISP | MNI | Wt. (g) | NISP | MNI | Wt. (g) |
|---|---|---|---|---|---|---|
| Unidentified, poss. Larus sp. | 1 | 1 | 0.6 | 1.6 | 1.6 | 1.0 |
| Unidentified | 2 | n/a | 0.8 | 3.2 | n/a | 1.3 |
| Bird Total | 3 | 1 | 1.4 | 4.8 | 1.6 | 2.2 |
| Gadus macrocephalus | 2 | 1 | 0.8 | 3.2 | 1.6 | 1.3 |
| Unidentified | 8 | n/a | 0.7 | 12.8 | n/a | 1.1 |
| Fish Total | 10 | 1 | 1.5 | 16 | 1.6 | 2.4 |
| Cetacea | 1 | 1 | 11.1 | 1.6 | 1.6 | 17.8 |
| Otariidae | 1 | 1 | 6.9 | 1.6 | 1.6 | 11.0 |
| Unidentified | 3 | n/a | 0.9 | 4.8 | n/a | 1.4 |
| Mammal Total | 5 | 2 | 18.9 | 8 | 3.2 | 30.2 |
| Balanus sp. | 6 | 1 | 0.2 | 9.6 | 1.6 | 0.3 |
| Mytilus edulis | n/a | 1.0 | 0.4 | n/a | 1.6 | 0.6 |
| Invertebrate Total | 6.0 | 2.0 | 0.6 | 9.6 | 3.2 | 1.0 |
Table 4.17, Analyzed Faunal Remains from TU4, Level 24. Righthand columns indicate measures adjusted for excavation volume (KV=1.6).
I recovered a small amount of faunal material from Level 24, less than 25 g of material in all (Table 4.17). Most of the material was badly eroded or broken; I speculated that this degradation may have happened before or during deposition. Thick mats of vegetal matter found in these strata imply that permafrost had effectively refrigerated this level, halting biological decay of the faunal materials shortly after deposition.
I could not identify the three bird bones from the TU4, Level 24 sample. A single bird ulna had some similarities to Larus bones in the comparative collection, but was too deteriorated to identify positively. Two gadid bones and eight unidentified but possible gadid bones comprised the total fish sample. Two large mammal bones—a vertebra possibly belonging to a sea lion or fur seal and a fragment of porous bone probably belonging to a cetacean—suggested the presence two large sea mammals. A few crushed barnacle shells and fragments of Mytilus periostracum, together weighing only a total of 5g, comprised the total invertebrate remains from Level 24.
Test Unit 4, Level 28 (Sample 4/28)
Level 28 was the lowest excavated level with associated artifacts in Test Unit 4. More than two and a half meters below the present-day surface of the site, the base of Level 28 is perhaps 40 cm from present high tide line. Most of the excavation level, especially the northern half of the unit, consists of sterile Stratum V sands. The southern half contained yellowish-brown silty anthropic soils, near the base of Stratum IV.
As with TU4, Level 24, the excavation of Level 28 proceeded smoothly. Permafrost complicated digging, but the sandy soil thawed quickly and could be dug when partially frozen. I estimate the volume of TU4, Level 28 to be 0.08 m3, and calculate a Volume Control Constant of KV = 1.25.
| Actual Values | Adjusted for Volume | |||||
| Taxon | NISP | MNI | Wt. (g) | NISP | MNI | Wt. (g) |
|---|---|---|---|---|---|---|
| Salmonidae | 1 | 1 | 0.2 | 1.3 | 1.3 | 0.3 |
| Scorpaenidae | 1 | 1 | 0.1 | 1.3 | 1.3 | 0.1 |
| Unidentified | 3 | n/a | 0.2 | 3.8 | n/a | 0.3 |
| Fish/Total | 5 | 2 | 0.5 | 6.3 | 2.5 | 0.6 |
| Odobenus | 2 | n/a | 222.2 | 2.5 | n/a | 277.8 |
| Unidentified | 16 | n/a | 9.2 | 20 | n/a | 11.5 |
| Mammal Total | 18 | 0 | 231.4 | 22.5 | 0 | 289.3 |
| Mytilus edulis | n/a | 1 | 1.6 | n/a | 1.3 | 2.0 |
Table 4.18, Analyzed Faunal Remains from TU4, Level 28. Righthand columns indicate measures adjusted for excavation volume (KV=1.25).
The excavation crew recovered few faunal remains from Level 28 (Table 4.18), an unsurprising result, considering the large amount of sterile beach sands comprising the excavated soils. Two walrus bones—rib and long bone fragments—weighed 222 g and comprised the vast majority of faunal material by weight. I could not distinguish these remains as a separate individual from the Odobenus bones found in Level 20, however. Another unidentified mammal was indicated by 16 small, badly eroded mammal bones. I analyzed five fish bones as well, two of which I identified as salmonid and scorpaenid. A few fragments of Mytilus periostracum indicated the presence of shellfish. The total lack of both bird bones and gadid bones set the TU4, Level 28 sample apart from all other analyzed faunal samples.
Test Unit 7, Level 7 (Sample 7/7)
I analyzed only one sample from Test Unit 7, an excavation unit with a much simpler stratigraphic history than TU4. Of the 15 excavated levels from TU7, I analyzed the faunal sample from Level 7 for two reasons. First, Level 7 contained significant amounts of midden material identified in excavation levels 7 through 9 in TU7, although not as much as either Level 8 or Level 9. Second, the material in the TU7 midden deposit appeared to contain more invertebrate remains than the TU4 midden deposit. Thus, analysis of the TU7, Level 7 sample broadened the interpretation of animal harvesting and processing at Nash Harbor by including a large sample of the phyla relatively poorly represented in TU4: mollusks and arthropods.
Bioturbation appeared to have played an important role in the history of the soils in TU7. Root penetration mixed soils in the upper 50 cm, and rodent activity disturbed apparent buried surfaces throughout the unit. A distinct band of dense shell and bone midden ran through the unit, designated Stratum II-4 on the stratigraphic profile (See Figure 2.5). The majority of faunal remains—especially fish and shellfish—were derived from the midden stratum.
Unlike Test Unit 4, Test Unit 7 lacked frozen soils and large features of flat stones; the excavation of this unit proceeded more easily than in Test Unit 4. Because of the erosion along the sea cliff, the unit was irregular in cross-section. I computed the total excavated volume of Level 7 at 0.08 m3, with KV = 1.25.
| Actual Values | Adjusted for Volume | |||||
| Taxon | NISP | MNI | Wt. (g) | NISP | MNI | Wt. (g) |
|---|---|---|---|---|---|---|
| Alcidae | 3 | 1 | 0.5 | 3.8 | 1.3 | 0.6 |
| Anatidae | 2 | 1 | 1.7 | 2.5 | 1.3 | 2.1 |
| Cepphus columba | 2 | 1 | 1.4 | 2.5 | 1.3 | 1.8 |
| Gavia sp. | 3 | 2 | 1.5 | 3.8 | 2.5 | 1.9 |
| Larus sp. | 5 | 1 | 3.8 | 6.3 | 1.3 | 4.8 |
| Phalacrocorax sp. | 14 | 2 | 36.4 | 17.5 | 2.5 | 45.5 |
| Rissa sp. | 4 | 1 | 1.8 | 5 | 1.3 | 2.3 |
| Uria sp. | 3 | 1 | 5 | 3.8 | 1.3 | 6.3 |
| Unidentified/possibly Alcidae | 39 | n/a | 8.9 | 48.8 | n/a | 11.1 |
| Not ID/Phalacrocoracidae or Anatidae | 8 | n/a | 7 | 10 | n/a | 8.8 |
| Unidentified | 10 | n/a | 3.9 | 12.5 | n/a | 4.9 |
| Bird Total | 93 | 10 | 71.9 | 116.3 | 12.5 | 89.9 |
Table 4.19, Analyzed Bird Remains from TU7, Level 7. Righthand columns indicate measures adjusted for excavation volume (KV=1.25).
I identified a large number and wide variety of bird remains—almost all from pelagic and cliff-dwelling birds—from the TU7 Level 7 sample (Table 4.19). Cormorants (Phalacrocorax sp.) were the most abundant birds by any measure, with 14 specimens weighing 36 g signifying the presence of at least two individuals. Other pelagic birds included at least one guillemot and one murre, and another alcid unidentified to genus. Gulls were also represented, with one Larus individual indicated by five specimens and one Rissa individual indicated by four specimens. Four specimens indicated the presence of at least one small loon, and two specimens were identfied as an anatid of unknown genus. Undifferentiated small long bone fragments, similar in size to alcid, small anatid, or small larid bones, remained unidentified.
| Actual Values | Adjusted for Volume | |||||
| Taxon | NISP | MNI | Wt. (g) | NISP | MNI | Wt. (g) |
|---|---|---|---|---|---|---|
| Gadus macrocephalus | 134 | 3 | 149.1 | 167.5 | 3.8 | 186.4 |
| Microgadus proximus | 34 | 4 | 28.8 | 42.5 | 5 | 36 |
| Salmonidae | 1 | 1 | 0.2 | 1.3 | 1.3 | 0.3 |
| Scorpaenidae, poss. Sebastes sp. | 50 | 3 | 15.6 | 62.5 | 3.8 | 19.5 |
| Hippoglossus stenolepis | 4 | 1 | 1.9 | 5 | 1.3 | 2.4 |
| Unidentified, but not Gadidae | 15 | n/a | 2.1 | 18.8 | n/a | 2.6 |
| Unidentified | 161 | n/a | 78.9 | 201.3 | n/a | 98.6 |
| Fish/Total | 399 | 12 | 276.6 | 498.8 | 15 | 345.8 |
Table 4.20, Analyzed Fish Remains from TU7, Level 7. Righthand columns indicate measures adjusted for excavation volume (KV=1.25).
I analyzed 399 fish bones and fragments weighing a total of 276 g from the TU7, Level 7 sample; of these, I identified 235 specimens (Table 4.20). Although Gadus remains comprised a majority of fish specimens identified, other fish made up a significant amount of the piscine fauna. One hundred thirty-four elements signified at least three Gadus individuals. At least three rockfish (Scorpaenidae, probably Sebastes sp.) and four individuals of a second variety of gadid (probably tomcod, Microgadus proximus) also contributed to the analyzed sample.
| Actual Values | Adjusted for Volume | |||||
| Taxon | NISP | MNI | Wt. (g) | NISP | MNI | Wt. (g) |
|---|---|---|---|---|---|---|
| Phocidae | 4 | 1 | 21.4 | 5 | 1.3 | 26.8 |
| Rangifer sp. | 2 | 1 | 84.8 | 2.5 | 1.3 | 106 |
| Synaptomys or Dicrostonyx | 1 | 1 | 0.1 | 1.3 | 1.3 | 0.1 |
| Unidentified/Phocidae? | 4 | n/a | 7.8 | 5 | n/a | 9.8 |
| Unidentified | 53 | n/a | 39.9 | 66.3 | n/a | 49.9 |
| Mammal/Total | 64 | 3 | 154 | 80 | 3.8 | 192.5 |
Table 4.21, Analyzed Mammal Remains from TU7, Level 7. Righthand columns indicate measures adjusted for excavation volume (KV=1.25).
Identification of the mammalian fauna in the TU7 proved more difficult than in other samples. Of the 64 bones and bone fragments, I identified only 11 specimens (Table 4.21). About 50 bone fragments, weighing 40 grams, were burned, and badly eroded. Many of the remaining bones were also worn and damaged, possibly by immediate post-depositional weathering. The remains of phocids and Rangifer were the most abundant, by weight and number of individual specimens, but I identified only one individual of each group. I also noted a portion of a small rodent cranium.
| Actual Values | Adjusted for Volume | |||||
| Taxon | NISP | MNI | Wt. (g) | NISP | MNI | Wt. (g) |
|---|---|---|---|---|---|---|
| Balanus sp. | 1 | 1 | 0.05 | 1.3 | 1.3 | 0.1 |
| Gastropoda | 1 | 1 | 1.7 | 1.3 | 1.3 | 2.1 |
| Macoma sp. | 11 | 1 | 2 | 13.8 | 1.3 | 2.5 |
| Mytilus edulis | 41 | 20 | 192.53 | 51.3 | 25.0 | 240.7 |
| Invertebrate/Total | 54 | 23 | 196.28 | 67.5 | 28.8 | 245.4 |
Table 4.22, Analyzed Invertebrate Remains from TU7, Level 7. Righthand columns indicate measures adjusted for excavation volume (KV=1.25).
The TU7 Level 7 sample was most notable for its abundant invertebrate remains, especially Mytilus shells (Table 4.22). Weighing 196g, mussel shells outweighed fish remains in the analyzed sample. As discussed in Section 3, the loss of a large amount of shell due to 1/4" screens used during excavation meant that this amount actually underrepresents the total number of shellfish remains. I noted 41 individual Mytilus hinges or hinge fragments, but did not determine their sides; I estimated the presence of at least 20 mussels. I found the remains of a few other invertebrate species—one complete marine snail (family and genus unknown), and eleven fragments of chalky clam shell, probably belonging to Macoma. A single fragment of acorn barnacle shell discovered during analysis proved enigmatic; it may have arrived in the midden as a hitchhiker on mussel shell collected by Nash Harbor residents.
5: Distribution of Faunal Materials
In discussing the distribution of faunal remains in my analyzed sample, I will seek to describe the faunal assemblage in a way that is meaningful for understanding human behavior. For this reason, I will reduce the number of analytical groups by lumping taxonomic categories based on methods of capture and processing.
To facilitate the direct comparison of faunal data from excavation units of varying size, I have employed the Volume Control Constant (KV) introduced in Section 3. Multiplying all data from a sample by KV allows me to pretend for analytic purposes that all data derive from uniform excavation units, one square meter in area and 10 cm thick. Such an approach misrepresents the relative taxonomic richness of a sample, which varies as a function of sample size (Grayson 1981:82–83). As the number of individual specimens recovered rises, the number of taxa identified should also rise; by manipulating my data with KV, I prevent the direct comparison of taxonomic richness between samples.

Figure 5.1, correlation of number of individual specimens and number of taxa in a sample. Best fit line is a power function of the form f(x) = a + bxc. NISP reflects numbers of individual specimens, not adjusted for volume.
Figure 5.1 demonstrates the relationship of NISP to taxonomic variation. In general, the number of taxa in a unit will rise exponentially as a function of NISP. The moderate correlation between NISP and number of taxa observed (R2 = 0.775) in this instance is probably due to the small number of sample units (n = 7). If I had identified more individuals to finer taxonomic resolution, then the total numbers of taxa identified would also be higher, possibly providing a stronger correlation between NISP and taxonomic richness.
As with the review of analyzed samples in Section 4, unless otherwise noted, all data referred to in Section 5 were derived from analyses of the 1/4" screen sample. Some data from analyses of bulk soil samples were germane to my discussion, however, and I will note the source of these data when I introduce them.
Distribution of Bird Remains
Remains of cliffdwelling birds—auks and cormorants—are the most abundant type of bird in the total analyzed sample (Figure 5.2) . When adjusted for excavation volume, Alcidae and Phalacrocoracidae represent the most abundant birds by all measures, comprising 58% of the identified bird sample by NISP, 49% by MNI, and 59% by bone weight. The presence of a single large Phalacrocorax individual in the TU7/7 sample may overrepresent cliff birds by weight, although their remains dominate the sample by measures of MNI and NISP as well. Birds usually caught while nesting or on open water—ducks, grebes, and loons—occur roughly as frequently as gulls; these two groups essentially tie for second place in abundance.

Figure 5.2: Identified bird remains from all analyzed samples, by Number of Individual Specimens, Minimum Number of Individuals, and Bone Weight. All measures adjusted for volume.


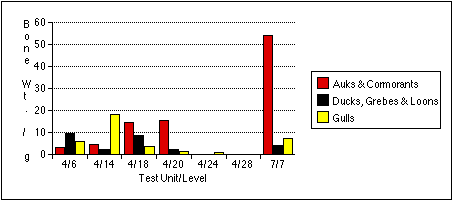
Figure 5.3a–c: Identified bird remains from analyzed samples, by Number of Individual Specimens, Minimum Number of Individuals, and Bone Weight. All measures adjusted for volume.
I noted auk and cormorant remains in all but two analyzed samples. After adjustments for excavated volume, sample units 4/18, 4/20, and 7/7 contain the greatest concentrations of these birds, as indicated by all measures (Figure 5.3a–c) . Cliff bird remains predominate in two other units: 4/6 and 4/14. Only the two levels near the bottom of Test Unit 4 (4/24 and 4/28) produced no Alcidae or Phalacrocoracidae bones. Cliff bird remains also tend to occur in larger concentrations than those of other birds (4/18 and 4/20); these loci may represent areas devoted to processing or dumping auk and cormorant remains.
The remains of marsh birds share a similar distribution to cliff birds, although in generally lower numbers. Only sample 4/6 produced the remains of ducks, grebes, and loons in greater relative quantity than those of auks and cormorants by all measures.
Larid remains are the most widely dispersed of all bird types, but often occur in the lowest numbers. Gull remains are the most abundant by NISP in sample 7/7, but more abundant by MNI and bone weight in sample 4/14. Larid bones occur in roughly equal frequencies throughout the other samples; they are the only birds identified in the Stratum IV soils from Test Unit 4.
Distribution of Fish Remains
Gadus macrocephalus distantly outrank all other identified fish taxa in the 1/4" screen sample (Figure 5.4). Pacific cod comprise 90.1% of NISP, 68.5% of the MNI, and 95.5% of the total weight of identified fish bone. With an analyzed piscine sample so overwhelmingly monopolized by a single species, I have difficultly addressing the relative importance of other species, except to note that Nash Harbor people also exploited a variety of other fish. Scorpaenids may represent the second most abundant fish, comprising 5.7% of all identified fish remains as indicated by NISP, and 12.7% by MNI.

Figure 5.4: Identified fish remains from all analyzed samples, by Number of Individual Specimens, Minimum Number of Individuals, and Bone Weight. All measures adjusted for excavation volume.
Gadus bones also tend to occur in distinct concentrations (Figure 5.5a–c). They are especially concentrated in sample 4/14, an unsurprising result given the discretionary nature of my sample selection process. I had targeted this unit precisely because it contained a preponderance of fish bone of an apparently uniform variety, and because the excavation level intersected with the fish bone midden deposit, Stratum II-9. Cod remains also predominate in samples 4/6, 4/14, and 4/18. Gadus remains are less dominant in the TU7/7 sample, where they are the most abundant fish by bone weight and NISP, but second to Pacific tomcod in MNI. The relative abundance of Gadus and other fish remains in TU7/7 may be skewed by the small sample size of this sample; if the fish bone sample recovered from TU7/7 were larger, non-Gadus fish might appear even more abundant. Other fish taxa eclipse Gadus in TU4, Level 28. Cod were completely absent from this sample, which contained the remains of a single salmonid and a single scorpaenid.
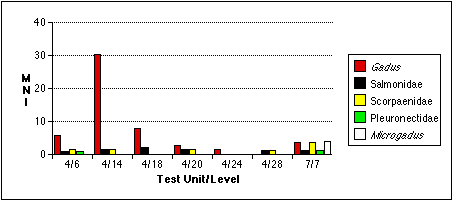


Figure 5.5a–c: Identified fish remains from analyzed samples, by Number of Individual Specimens, Minimum Number of Individuals, and Bone Weight. All measures adjusted for volume.
Distribution of particular Gadus elements in the analyzed faunal collection indicates the differential deposition of cod heads and bodies. In the total sample of identified Gadus individuals, the ratio of MNI computed using the most abundant cranial element (the basioccipital) versus the MNI computed using the most abundant postcranial element (precaudal vertebrae) is 33:3.7, or 8.9 times more cranial than postcranial individuals (Figure 5.6). These figures assume an average of 52.3 vertebrae per individual (Hart 1973:223). While some vertebrae may have been damaged or lost during excavation, the prevalance of fragile cranial elements (18 frontals, for example), suggests that this ratio represented the differential treatment of cod heads.

Figure 5.6: Minimum number of Gadus macrocephalus individuals indicated by selected elements, from all analyzed units. Not adjusted for excavation volume.
Three elements appear to vary from the skewed distribution of cranial and postcranial elements: left and right posttemporals and the atlas vertebra. In gadids, pectoral girdle bones such as the posttemporal actually lie posterior to the base of the head (as indicated by the articular surface of the basioccipital; Cannon 1987:45), so I consider these bones marginal to the cranium. When I compute postcranial MNI using left posttemporals (potentially the most abundant postcranial element), this lowers the cranial to postcranial MNI ratio to 33:6, or 5.5. The anomalous distribution of atlas vertebrae is best explained by noting that atlases are the first vertebrae immediate posterior to the basioccipital; each Gadus has only one atlas vertebrae (Cannon 1987). If the distribution of cranial and postcranial elements in the analyzed samples is related to a butchering practice involving the beheading of cod, then I would expect that the atlas would represent the most abundant vertebral element, and a better indicator of cranial MNI than postcranial MNI.
I did not observe the differential distribution of Gadus macrocephalus heads and bodies equally through all sample units, however (Figure 5.7). When adjusted for excavation volume, sample 4/14 has the highest ratio of cranial to postcranial elements: 30.4 individuals computed using the most abundant cranial element versus 4.8 computed using vertebral elements, or 6.3 times more cod heads than cod bodies. Conversely, sample 7/7 has nearly equal distributions of cranial and postcranial elements: at least 3.75 crania and 2.5 vertebral columns, or only 1.5 times more cod heads than cod bodies.

Figure 5.7: Distribution of Gadus macrocephalus by MNI indicated by cranial and postcranial elements. Adjusted for excavation volume.
Finally, the presence of 150 Clupea bones (149 vertebrae and one basioccipital) in the 4/18 sample raised the possibility that herring may also have figured prominently in the Nash Harbor economy. Unfortunately, the field use of 1/4"screens precludes my ability to quantify the importance of these small fish to the Nash Harbor people. I can only note that I missed some amount of herring bones during excavation, and leave the question of their significance open.
Distribution of Mammal Remains
Examination of the mammalian remains from the analyzed samples reveals a wide variety of mammals exploited by Nash Harbor people. The bulk of mammal remains, however, belong to marine animals—pinnipeds and cetaceans. After adjustments for excavation volumes, marine mammals comprise 65.5% of all identified mammal specimens, 70.2% of the identified individuals, and 84.5% of the total bone weight (Figure 5.8).

Figure 5.8: Identified terrestrial and marine mammal remains from all analyzed samples, by Number of Individual Specimens, Minimum Number of Individuals, and Bone Weight. All measures adjusted for volume.
With the exception of the TU7, Level 7 sample, marine mammal remains outnumber terrestrial remains in all units by most measures(Figures 5.9 a–c). Land mammal remains outweigh marine mammal remains in the TU4, Level 18 sample, probably because much of the marine mammal material recovered from this level belonged to a small juvenile phocid.


Figures 5.9 a–c: Identified terrestrial and marine mammal remains from analyzed samples, by Number of Individual Specimens, Minimum Number of Individuals, and Bone Weight. All measures adjusted for volume.
Two groups comprised nearly the entire analyzed terrestrial mammal sample: Canidae and Rangifer. By all measures, canids—including dogs, wolves, and foxes—outnumber Rangifer, although their degree of dominance varies by measure (Figure 5.10). The relative abundance of either genus varies between units and according to the method of measurement, but Canidae remains appear in four sample units, whereas Rangifer remains appear in only three sample units (Figure 5.11 a–c).

Figure 5.10: Identified Canidae and Rangifer remains from all analyzed samples, by Number of Individual Specimens, Minimum Number of Individuals, and Bone Weight. All measures adjusted for volume.
The difficulty of distinguishing dog species archaeologically complicates interpretation of the canid remains. Four varieties of canid are known to be found on Nunivak Island: domestic dog, wolf, and two species of fox (Lantis 1946). I distinguished between these species in my sample mainly by size. Wolves probably contributed the largest identified canid specimens, found in the TU4/20 sample; foxes probably contributed the smallest—several teeth found in TU4/6. I assumed that other canid remains probably belonged to the domestic dog.
Similary, Rangifer remains could either belong to caribou or reindeer. Caribou populations fluctuated widely on Nunivak Island, and mainland Yupiit armed with high-power rifles exterminated these animals in the late 19th century. Reindeer were introduced by American traders early in the 20th century to replace the extinct caribou (Griffin 1996). The distinction between these two species therefore serves as an important temporal marker—but without Rangifer in the comparative collection, I was unable to distinguish between them. Based on radiocarbon dates and a lack of associated historic artifacts, however, I assumed that all Rangifer remains predate the 20th century, and belong to caribou.


Figure 5.11 a–c: Identified Canidae and Rangifer remains from analyzed samples, by Number of Individual Specimens, Minimum Number of Individuals, and Bone Weight. All measures adjusted for excavation volume.
The relative abundances of sea mammal remains are more difficult to gauge than those of land mammals. Among all samples (adjusted for excavation volumes), Odobenus rosmarus and Phocidae appear to represent the first and second most abundant taxa (Figure 5.12). Phocids contribute 79.6% of the identified specimens, but only 20.1% of the identified bone mass. Odobenids have the opposite distribution, comprising 13.1% of the identified specimens but 57.6% of the identified bone weight. I find this result unsurprising, considering the overall size of each animal—except for beluga, walrus were the most massive animal traditionally taken by the Nunivarrmiut. A few Odobenus specimens would outweigh dozens of phocid bones. In the analyzed Nash Harbor sample, at least two phocid individuals were juveniles. Similarly, Otariidae and Cetacea remains constitute the third and fourth most abundant taxa by all measures.

Figure 5.12: Identified marine mammal remains from all analyzed samples, by NISP, MNI, and Bone weight in grams. Adjusted for volume.
Limited sample size and area of excavation may explain the lack of strong patterning in the distribution of marine mammal remains (Figure 5.13 a–c). Phocid remains are the most widely distributed, found in five units. Phocids were also the most concentrated: after adjusting for excavated volume, TU4/18 contained 60 phocid specimens and four individuals. Odobenid remains were also spread throughout the sample, with remains found in four sample units. However, I characterize the sea mammal sample as patchily distributed, and add the caveat that this may reflect sample size rather than a particular Ellikarrmiut hunting or processing pattern.


Figure 5.13 a–c: Identified marine mammal remains from analyzed samples, by NISP, MNI, and Bone Weight ingrams. All measures adjusted for volume.
Distribution of Invertebrate Remains
Mytilus remains dominate the analyzed invertebrate sample (Figure 5.14). When adjusted for variations in excavation volume, Mytilus constitute 89.2% of the all invertebrate remains. Macoma shell contribute 9.9% of the shell sample, with less than 1% of the shell sample deriving from Balanus (acorn barnacle) and unidentified marine gastropods.

Figure 5.14: Identified invertebrate remains from all analyzed samples, by shell weight.
Adjusted for excavation volume.
Virtually all shellfish remains were found in the TU7/7 sample; this certainly reflected a bias in sample selection as well as the actual distribution of shellfish (Figure 5.15). TU7 contained the largest concentration of shell midden material discovered by archaeologists at Nash Harbor, and I included one sample from TU7 to provide some data on invertebrate harvesting patterns. I also noted a large amount of Mytilus shell in the fish bone midden deposit intersecting TU4/14, and I identified several Macoma shell fragments in the TU4/6 sample.
The analysis of invertebrates almost certainly under-represents their actual abundance at Nash Harbor. Screeners noted amounts of Mytilus periostraca during excavation; many of these remains were crushed during screening, or blown out of the screens by the strong Nunivak winds. The use of 1/4" screens during excavation also led to the loss of an unknown amount of shell, which was often so finely fragmented that it passed through the excavation screens.

Figure 5.15: Distribution of invertebrate remains by shell weight, adjusted for excavation volumes.
Distribution of Major Taxonomic Groups
After adjusting measures for excavation volumes, fish are probably the most abundant animals, representing 85.2% of the identified vertebrate specimens, 44.6% of the identfied vertebrate individuals, and 41.7% of the total weight of the analyzed sample (Figure 5.16). Mammals contribute 46.2% of the total weight of the analyzed sample, but only 18.3% of identified vertebrates, and 8.2% of vertebrate specimens. Conversely, birds represent 37% of the identified vertebrate individuals, but only about 8% of either individual vertebrate specimens or total faunal weight. Shellfish, because of their highly fragmentary remains, are comparable to vertebrates only in shell weight, where they constitute a scant 3.7% of the analyzed remains.
Variations in the size of the different taxa partly explain these contradictory data. Except for Mustelidae, the smallest mammal individual would outweigh the largest individual of any other taxon. The remains of a single walrus individual, represented only by a few fragments, outweighs dozens of more complete bird skeletons. Bird bones, on the other hand, were less fragmented than mammal bones, and easier to identify generally. While I could identify 68.5% of the bird specimens, I could only identify 55.1% of the mammal specimens. Thus, the MNI for birds would necessarily be higher than for other taxa.
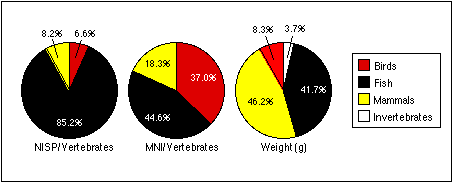
Figure 5.16: Identified animal remains from all analyzed samples, by Number of Individual Specimens, Minimum Number of Individuals, and Bone Weight. Measures for NISP and weight include identified and unidentifed remains; all measures adjusted for excavation volume.


Figure 5.17 a–c: Distribution of faunal remains in analyzed units, by Bone Weight in grams, NISP, and MNI. All measures adjusted for volume. Includes identified and unidentified remains.
Fish bones had the widest spatial distribution of any taxa but also tended to occur in the largest concentrations—outranking other taxa by all measures in TU4/6 and TU7/7 (Figure 5.17 a–c) . Bird remains tended to be widely distributed, but not as concentrated, except as measured by MNI in TU4/18. Mammal remains were found in all samples, in varying quantities, again probably as a function of animal and sample size. Only mammal remains were found in any measurable abundance in TU4/24 and TU4/28. Invertebrate remains were the least highly dispersed of all taxa, found in significant quantities only in TU7/7, with a very few found in TU4/6 and TU4/14.
After careful consideration of the spatial distribution of faunal remains, I can characterize the analyzed samples with the following summary statements:
No taxon predominated in TU4/6, except that Gadus—as in other units where fish were found in significant quantities—were clearly the most abundant fish. Except for a few Macoma, invertebrate remains were generally scarce. The mammalian sample was typified by a few large Odobenus specimens.
TU4/14 represented a trash heap of fish bones, associated with a processing activity resulting in the differential deposition of Gadus crania here. Remains of other taxa, especially gulls, cliff birds, and sea mammals, were also abundant.
TU4/18 represented a deposit of fish and bird bones. As with TU4/14, Gadus crania were more numerous than vertebrae. Cliff birds' remains were most concentrated in this sample. Seal and canid predominated among mammalian remains, although a few fragments of whale bone made Cetacea more abundant by bone weight. The presence of Clupea harengus vertebrae in the bulk sample from TU4/18 suggests that herring may also be abundant in this unit, but I can not estimate their relative abundance.
Faunal materials were more scarce in TU4/20 than in the analyzed samples above it. A few Odobenus specimens outweighed all other animal remains, but Phocidae were the most common sea mammals by NISP. Cliff birds remained the most common avians.
Faunal materials were almost entirely lacking in TU4/24 and TU4/28, except for a few large Odobenus specimens in TU4/28. Notably, these units contained no Gadus remains. The paucity of trash in these levels may bolster the hypothesis that this stratum represented a collapsed structure, as advanced in Section 2.
Mytilus remains predominated in TU7/7, almost exceeding fish remains in weight. Gadus remains were common, but unlike other samples containing Gadus, cranial and postcranial individuals were nearly equally represented. Quite a few cliff birds were found here as well. I characterize TU7/7 as associated with shellfish and cliff bird processing.
6: Ellikarrmiut Animal Resource Economies
Historic Eskimo peoples like the Cupiit depended upon animal products for food, skins, and other products (Oswalt 1967). Of course, the Nunivarrmiut have access to non-animal resources as well: driftwood, trade goods, rye grass, and a variety of greens; but animals provided the majority of food and clothing (Lantis 1946). Study of the animal remains recovered from midden deposits at Ellikarrmiut reveals some of the activities of the people who lived here about 400 years ago.
Birding
Although probably not a staple of the residents’ diets, birds played an important role in the Nash Harbor economy. Nash Harbor's proximity to the sea cliffs forming the northwestern corner of Nunivak Island provided close access to a rich variety of birds. Not only could Nash Harbor people eat these animals and their eggs, but they could also make ornaments and clothing from bird skins. They could trade the skins to people living on the eastern portion of the island, and to Yupiit people on Nelson Island and the mainland.
The profusion of cliff bird remains in the analyzed samples, especially in the 4/18, 4/20, and 7/7 samples may reflect their special status as wealth and trade items to Nash Harbor people. Pratt (1990) and Lantis (1946, 1986) described the capture of these birds while “cliffhanging,” a risky venture that yielded considerable wealth in food, skins, and beaks for the Nunivarrmiut. A hunter, often working with a partner, would descend from the clifftops on sealskin or walrus skin ropes, and net or snare cliff-dwelling birds. The Nash Harbor people traded puffin, murre, auklet, and cormorant skins and beaks with their neighbors in Mekoryuk and other towns to the east, who had limited access to these items (Hoffman 1990:67; Pratt 1990:77; VanStone 1989:35; Lantis 1946:169, 170). Cliffhangers also gathered eggs and greens from the cliffs, prized foods that archaeologists would have difficulty recovering (Pratt 1990). Oral historical evidence suggests that the cliffs nearest Nash Harbor were not used, but that Nash Harbor cliffhangers usually travelled to the larger cliffs forming the northwest corner of the island (Pratt 1990; Griffin 1997, personal communication).
Although probably second to auks and cormorants in importance, waterfowl also represented a proportion of Nash Harbor economy. Lantis (1986:214, 1946:172) reported that the Nunivarrmiut often speared ducks, scoters, grebes and loons on the open water. Mainland Yupiit snared or speared these birds on the ground while they nested, or during their summer molts (Shaw 1983). VanStone (1989:9–11) described hunters shooting waterfowl—and murres and cormorants—on the open water with bows and arrows, or with three-pronged bird spears.
A wide variety of gulls nest on Nunivak Island on cliffs and on open ground; kittiwakes nest primarily on sea cliffs (Armstrong 1980). Capture of these animals would have required the same techniques as the capture of cliff-birds and waterfowl. Gulls tend not to be as concentrated in large rookeries as other cliff-dwelling birds (Swarth 1934). Gull remains occurred in small numbers in almost all samples, but were more abundant when found with other birds. This distribution may indicate that gulls did not represent a specialized economy, as with other cliff birds. Perhaps Ellikarrmiut birders took gulls in a wide variety of situations—either while cliffhanging or while hunting on the water or open tundra. Renowned Nunivarrmiut cliffhanger Andrew Noatak and other hunters avoided gull nests while cliff-hanging, since gulls tend to nest on unstable scree that offers poor footing (Hoffman 1990:69). Neither VanStone (1989) nor Pratt (1990) described any trade of gull skins.
Chatters (1972) noted that anatid and gavid remains predominated the avian sample from sites near Mekoryuk Village (49-NI-028 and 49-NI-030) during Norton times (150 B.C. to A.D. 600), with alcids and phalacrocoracids ranking distant second and third. Neither Chatters (1972) nor Nowak (1982) detailed the condition of excavations at the Mekoryuk Village sites, although screens were apparently not used, so these data are not easily compared to the Nash Harbor results. However, I found the preponderance of cliff birds at Nash Harbor compared to Mekoryuk Village unsurprising, given Nash Harbor’s close proximity to the sea cliffs forming the northwestern corner of Nunivak Island.
With the exception of a possible Arctic loon (Gavia arctica) all the birds represented in the analyzed Nash Harbor sample reside seasonally on Nunivak, either during migrations in the spring and fall, or during the summer breeding season (Armstrong 1980; Swarth 1934). Pratt (1990:77) indicated that cliffhangers concentrated their activities during the spring and summer, when populations of cliff birds were densest, and when they displayed breeding plumage. The importance of birds is reflected in traditional Cup'ig names for the lunar months between late April to August: “Kittiwakes” (late April), “Birds” (May), “Birds Breeding” (June), “Murre Gone Away” (July), and “Puffin Gone Away” (August) (Lantis 1946:171). Deposition of bird remains—especially alcids—probably occurred between May and August.
Fishing
As indicated by the analyzed sample from 1/4" screens, Nash Harbor people probably relied heavily on the catch of Pacific cod. These animals constituted the overwhelming majority of fish remains in the analyzed sample, and perhaps the majority of all animal remains. The predominance of cod heads, as opposed to cod vertebrae, suggests that the Nash Harbor people not only took cods in great numbers, but butchered them in a regular way that left cod heads in one place and cod vertebrae someplace else, or destroyed them altogether.
Some ethnographic data illuminate possible cod fishing and processing practices. Oswalt (1967:128, probably following Lantis 1946) indicated that Nunivarrmiut fishermen relied less on fishhooks than nets and spears for taking fish. Lantis (1986:214) noted that the Nunivarrmiut took riverine fish with weirs, nets, traps, and multi-pronged spears; they also used large composite hooks for cod (Lantis 1946:173). VanStone (1989:13) indicated that the Nunivarrmiut fished for cod in the spring, spearing them from kayaks, or using a weighted line and hook. Cod are usually deep benthic fish, coming in close to shore in the spring and early summer, where they are more easily hooked (Hart 1973:222–224; Shimada and Kimura 1994:814). In the early 20th century, Nash Harbor was renowned for having a good cod fishery (Griffin 1996; 1997 personal communication).
Lantis (1986:214) noted that fish were frozen, boiled, or dried, but not smoked. Dried fish were an important staple through the winter (Lantis 1946:172–180). VanStone (1989:14–15) wrote that “salmon and other fish caught through mid-summer were split, cleaned, scored, and hung of racks to dry.” He also noted that “cod were cut along the back in the same manner as salmon,” and then the “split heads and eggs were buried in pits lined with grass and covered with sod” (VanStone 1989:30). Such a processing method could fragment vertebrae, leading to an uneven distribution of cod heads and vertebrae. This explanation also suggests a purpose for the flat stones of Feature 1 in TU4. VanStone (1989:31) indicated that after decapitating the cod, the Nunivarrmiut would spread the heads and bodies on rocks to dry. In 1927, Edward Curtis photographed a pile of cod heads at Cape Etolin (near Mekoryuk), probably the byproduct of some processing method. The catching and processing of cod indicates a deposition of these animals’ remains from late spring through mid-summer.
The Nash Harbor people caught other fish as well. They probably speared or hooked tomcod while ice fishing, or in in seine nets in the fall (VanStone 1989:12–13; Lantis 1946:174). They also took tomcod, flounder, and herring with seine nets. One person on shore held one end of a long seine net, while a kayaker closed the seine by drawing the end close to shore. I discovered no ethnographic reference to scorpaenid fishing techniques on Nunivak, so can only speculate that these marine fish could have been caught in shallow to moderately deep water, with hooks and lines, or seine nets.
The presence of 150 herring bones in the TU4/18 bulk sample suggests that these small fish may also have figured in the Nash Harbor economy, but excavation techniques have obscured their actual importance. VanStone (1989:13) indicated that the Nunivarrmiut took herring in the spring using seine nets. Small fish such as herring were strung along a line, and then hung to dry.
Mammal Hunting
Sea mammals, along with cod, probably formed a staple of the Nash Harbor economy. Seals and walruses were probably most important, although with the limited sample analyzed here it is difficult to gauge the actual importance of either animal. Seals may have been even more abundant than indicated, since oral histories record that proper respect for seals involved the disposal of their remains in the sea (Griffin 1996, personal communication). Place name studies indicate several important sealing sites near Nash Harbor, which was recorded as an important base for sealing operations (Lantis 1946:162–163, 172–178).
VanStone (1989:6–10) described seal hunting in some detail. The spring seal hunt was most important, and large ceremonial preparations preceded the hunt. Hunters harpooned the seals in the open water from kayaks, or on the sea ice as the animals basked in the sun, although Oswalt (1967:128) stated that the Nunivarrmiut did not take seals from the ice. In the fall, before the onset of sea ice, hunters took seals in nets. Oswalt (1967:128) and Lantis (1946:181) asserted that seals were also hunted in the fall, and VanStone (1989:8) observed that seal hunting slacked during the summer. In the fall, the Nunivarrmiut netted seals with nets strung between the shore and floats set 25 to 100 m out. The nets were used through holes in the ice during the winter. Beluga and sea lions occasionally appeared in the seal nets, although all ethnographic sources agree that these animals were incidental to the catch—which helps explain the scarcity of otarid and cetacean remains in the analyzed sample from Nash Harbor. Most phocids give birth in late winter or early spring, on pack ice or land (Burt and Grossenheider 1976). The presence of juvenile seal remains in TU4 suggests that the Ellikarrmiut hunted seals at these times.
The Nunivarrmiut hunted walrus—probably the second most important mammal at Nash Harbor—primarily in the spring, when the edge of the sea ice moved past the island (VanStone 1989:9; Lantis 1946:177). Walrus hunters worked from kayaks in small groups, since walrus were capable of upsetting single kayaks. Lone walrus were taken occasionally on the sea ice in winter, and walrus carcasses often washed ashore in summer and autumn (Lantis 1946:179). The Nunivarrmiut prized walrus meat even more than that of seal meat (VanStone 1989:30).
Caribou remains comprised a small proportion of the analyzed sample; they may not have contributed significantly to the Nash Harbor economy. VanStone (1989:10) described caribou hunting techniques. According to VanStone, caribou were the most important land mammal, hunted in the spring after the seal hunt, and during the winter. Lantis (1946:172) stated that “[m]ost caribou hunting took place in early summer.” The Nunivarrmiut hunted them traditionally with composite bows and arrows; VanStone contends that they did not usually drive caribou into enclosures, as mainland peoples did. I encountered no discussion of the butchering of caribou, however. It is possible that caribou were butchered away from the village, and only portions of the animal brought back to the village. Such a situation would explain the paucity of caribou remains at the site: antler fragments, a tooth, and a single tarsal. I have left open the question of whether these remains might instead be reindeer, since I believe the midden materials predate the introduction of reindeer by at least 300 years. However, should this belief prove false, the Rangifer remains may actually signifiy the presence of reindeer.
Canid remains were the most abundant identified terrestrial mammals, a finding I have difficulty interpreting. Neither VanStone (1989) nor Lantis (1946) described the Nunivarrmiut as eating domestic dogs, although VanStone (1989:38, 108) and Lantis (1946:179) detailed the use of puppy skins for making children's parkas. Dogs were also important as beasts of burden (VanStone 1989:20). I have also tentatively identified two canid individuals as wolf and fox. Arctic foxes, red foxes, and wolves were caught in traps, especially during the winter, when their coats were fullest (VanStone 1989:12). The Nunivarrmiut eschewed red fox meat, but used the furs of all wild canids for making clothing (VanStone 1989:30, 32).
A single Mustelidae humerus found in TU4/6 also indicates that the Nash Harbor people may have captured weasels or minks as well, although traditional methods for trapping minks on land had been forgotten (VanStone 1989:12). Curtis (1930) outlines a method for catching mink in the water, using a wicker trap. The humerus found in 4/6 might also be intrusive into the midden, as mustelids are active burrowers (Burt and Grossenheider 1976).
Shellfish Gathering
The role of shellfish in the economy of Nash Harbor remains enigmatic. As outlined in Section 5, invertebrate (mostly mussel) shells contributed only 3.7% of the weight of animal remains in the analyzed sample, although this is a result of sampling. The large concentration of mussel shells in TU7/7 (and elsewhere in TU7) indicates that Nash Harbor people gathered mussels in great quantity, probably during the summer.
The winter sea ice would have constrained shellfish gathering in three ways. First, shellfish gathering would simply have been impossible about half the year, because ice covered the littoral zone. Second, the sea ice scours the high to low littoral zones, scraping bivalve spat from the rocks. Mussels (or other sessile invertebrates) could therefore be taken only during very low neap tides. Third, the long, cold winter and the generally frigid Bering sea waters would limit mussel growth, making shellfish exploitation here less profitable than in other, warmer areas.
Nonetheless, the Nash Harbor people appear to have eaten significant quantities of shellfish, mostly mussels but also Macoma clams. I discovered no ethnographic record of clamming on Nunivak, but Lantis (1986: 214) observed that the Nunivarrmiut ate mussels raw; VanStone (1989:31) repeats the observation. A lack of evidence for burning of mussel shells in the analyzed sample may bear this out, but of course the Ellikarrmiut may simply have shucked mussels raw, then dried or smoked the meat. VanStone (1989: 32) suggested another use for mussel shells: to scrape hair from seal skins.
Nash Harbor Economy & Patterns of Site Use, ca. A.D. 1550
Ethnohistorians have represented Nash Harbor as a sealing and cod-fishing camp, and a center for cliff-birding (Griffin 1996; Lantis 1946). Zooarchaeological analyses largely support this representation, although the variety of animals actually found in the faunal sample reveals a much more diverse economy. The Ellikarrmiut focused their attention on cod, seals, cliff birds, and walrus, but also took tomcod, salmonids, mussels, ducks, grebes, loons, sea lions, and caribou. They probably traded many of the birds they caught to people living on the eastern portion of the island, and to mainland Yupiit peoples. Excavation and recovery techniques have masked the importance of other animals, especially herring, and the differential butchering and transport of caribou remains may underrerpresent the actual importance of these animals. The Ellikarrmiut may have also taken fur animals such as wolves, foxes, and weasels or minks.

Figure 6.1, Seasons of Cupiit animal capture, based on VanStone (1989) and Lantis (1946), in order of approximate abundance in sample. Light bars indicate times of animals’ availability; dark bars indicate traditional times of capture.
Drawing upon the archaeological and ethnohistoric evidence outlined above, I can characterize Ellikarrmiut, about 400 years ago, as a settlement with evidence for use in the spring and summer Figure 6.1. Cupiit practices of food storage make the differentiation of winter occupation more difficult; since summer foods were stored and consumed through the winter (Lantis 1946), the presence of animals believed to have been captured during the summer does not necessarily indicate a summer occupation. However, the presence of juvenile phocids in the analyzed sample is a strong indicator of late winter and early spring hunting by Nash Harbor residents. The evidence for cod processing also implicates summer occupation, a finding bolstered by the abundant mussel shell deposits recovered from the site. Since the Nunivarrmiut did not store mussels (Lantis 1946; VanStone 1989), mussel shell deposits from Nash Harbor indicate occupation during mussel season (May through August).
The present study has reviewed only a tiny a fraction of the faunal materials recovered from Nash Harbor in 1996. As more materials come under study, and as more archaeological investigations take place at Nash Harbor, more finely-tuned analyses will inevitably result. These analyses can help flesh out my description of the Ellikarrmiut of Late Thule times: a people utilizing a wide variety of fish, bird, shellfish, terrestrial mammal, and sea mammal resources, focusing on cod, seals, walrus, cormorants, and murres.
Acknowledgments & References Cited
I owe debts of gratitude to Dennis Griffin and Dr. Madonna Moss, for their attention and patient tutelage; to Dr. Don Dumond and Dr. G. Gordon Goles, for their editorial feedback; to Chris Broyles, for her insights, camaraderie, commiseration, and repeatedly humiliating me at card games; to the Nash Harbor Project excavation crew of Galen Float, Leroy Hendrickson, Marlene Kiokan, Martha Whitman, and Brady Williams, for working hard in difficult conditions; to the people of Mekoryuk, whose hospitalities are innumerable; to my parents, Vernon and Rebecca Souders, and my brother, Karl Souders, for their financial and moral support.
References Cited
- Armstrong, Robert H.
- 1980. A Guide to the Birds of Alaska. Anchorage, Alaska: Alaska Northwest Publishing Company.
- Bird, Eric C. F.
- 1984. Coasts. Canberra: Australian National University Press.
- Bockstoce, John
- 1973. A Prehistoric Population Change in the Bering Strait Region. Polar Record 16:793–803.
- Burt, William H. and Richard P. Grossenheider
- 1976. A Field Guide to the Mammals, North America North of Mexico. The Peterson Field Guide Series, New York: Houghton Mifflin.
- Chatters, James C.
- 1972. The Faunal Analysis of Sites MK2 and MK4, Nunivak, Alaska. Ms in possession of author.
- Cannon, Debbi Yee
- 1987. Marine Fish Osteology: A Manual for Archaeologists. Burnaby, British Columbia: Department of Archaeology, Simon Frasier University.
- Curtis, Edward S.
- 1930. The North American Indian, vol. 20. Privately printed. 1970 reprint: New York: Johnson Reprint Corp.
- Davis, Simon J. M.
- 1987 The Archaeology of Animals. New Haven and London: Yale University Press.
- Dumond, Don
- 1982. Trends and Traditions in Alaskan Prehistory: The Place of Norton Culture. Arctic Anthropology 19(2):39–51.
- 1986. “Prehistory of the Bering Sea Region,” in The Handbook of the North American Indian, vol. 5: The Arctic, David Damas, ed. pp. 94–105. Washington: Smithsonian.
- 1987. The Eskimos and Aleuts. London: Thames and Hudson.
- Foster, Nora R.
- 1991. Intertidal Bivalves: A Guide to the Common Marine Bivalves of Alaska. University of Alaska Press.
- Ganopole, Gerald
- 1972. Geologic Report: Nunivak Island and Clarence Rhode National Wildlife Refuges and Adjacent Areas. Ms on file, at U.S. Fish and Wildlife Service, Anchorage, Alaska.
- Gilbert, B. Miles
- 1973. Mammalian Osteo-Archaeology: North America. Columbia, Missouri: University of Missouri Special Publications.
- Gillespie, Richard
- 1986. Radiocarbon User's Handbook. Oxford: Oxbow Books.
- Grayson, Donald K.
- 1973. On the Methodology of Faunal Analysis. American Antiquity 39(4):432–439.
- 1981. A Critical View of the Use of Archaeological Vertebrates in Paleoenvironmental Reconstruction. Journal of Ethnobiology 1(1):28–38.
- Griffin, Dennis
- 1996. Portrait of Nash Harbor: Prehistory, History, and Lifeways of an Alaskan Community. Dissertation prospectus, on file at Department of Anthropology, University of Oregon, Eugene.
- Hart, J. L.
- 1973. Pacific Fishes of Canada. Ottawa: Fisheries Research Board of Canada, Bulletin 180.
- Hartman, Charles W. and Philip R. Johnson
- 1978. Environmental Atlas of Alaska. Fairbanks : Institute of Water Resources, University of Alaska.
- Hesse, Brian and Paula Wapnish
- 1985. Animal Bone Archeology: From Objectives to Analysis. University of Alabama Birmingham and Smithsonian Institution Manuals on Archeology 5. Washington: Taraxacum Inc.
- Hoffman, Brian W.
- 1990. Bird Netting, Cliff-Hanging, and Egg Gathering: Traditional Procurement Strategies on Nunivak Island. Arctic Anthropology 27(1): 66–74.
- Holliday, Vance T. and Paul Goldberg
- Glossary of Selected Soil Science Terms. In Soils in Archaeology: Landscape Evolution and Human Occupation, Vance T. Holliday, ed., pp. 247–254. Washington: Smithsonian Institution Press.
- Lamb, Andrew and Philip Edgell
- 1986. Coastal Fishes of the Pacific Northwest. Madeira Park, Canada: Harbor Publishing.
- Lantis, Margaret
- 1946. The Social Culture of the Nunivak Eskimo. Philadelphia: Transactions of the American Philosophical Society, new series, vol. 35, pt. 3.
- 1986. Nunivak Eskimo. In The Handbook of the North American Indian, vol. 5: The Arctic, David Damas, ed. pp. 209 223 105. Washington: Smithsonian.
- Lutz, Bruce J.
- 1982. Population Pressure and Climate as Dynamics within the Arctic Small Tool Tradition of Alaska. Arctic Anthropology 19(2):143–149.
- Lyman, R. Lee
- 1994. Vertebrate Taphonomy. Cambridge University Press.
- McConnaughey, Bayard H. and Evelyn McConnaughey
- 1985. Pacific Coast. The Audubon Society Nature Guides, New York: Alfred A. Knopf.
- Nowak, Michael
- 1982. The Norton Period of Nunivak Island: Internal Change and External Influence. Arctic Anthropology 19(2):75–91.
- 1988a. Post Norton Nunivak: A Study in Coastal Adaptation. In The Late Prehistoric Development of Alaska&rsqsuo;s Native People, Robert D. Shaw, R. K. Harritt, D. E. Dumond, eds. Alaska Anthropological Association Monograph Series No. 4, Aurora.
- 1988b. Sea Mammals in a Mixed Economy: A Southwestern Alaskan Case. Arctic Anthropology 25(1): 44–51.
- Oswalt, Wendell H.
- 1967. Alaskan Eskimos. San Francisco: Chandler Publishing.
- Peterson, Roger Tory
- 1990. A Field Guide to Western Birds. New York: Houghton Mifflin.
- Pratt, Kenneth L.
- 1990. Economic and Social Aspects of Nunivak Eskimo “Cliff-Hanging.” Arctic Anthropology 27(1):75–86.
- Shaw, Robert D.
- 1982. The Expansion and Survival of the Norton Tradition on the Yukon-Kuskokwim Delta. Arctic Anthropology 19(2):59–73.
- 1983 The Archaeology of the Manokinak Site: A Study of the Cultural Transition Between Late Norton Tradition and Historic Eskimo. PhD dissertation, Department of Anthropology, Washington State University.
- Shaw, Robert D. and Charles E. Holmes
- 1982. The Norton Interaction Sphere: An Orientation. Arctic Anthropology 19(2):3–10.
- Shimada, Allen M. and Daniel K. Kimura
- 1994. Seasonal movements of Pacific cod, Gadus Macrocephalus, in the eastern Bering Sea and adjacent waters based on tag-recapture data. Fishery Bulletin 92:800–816.
- Smith, George S.
- 1979. Mammalian Zooarchaeology, Alaska: A Manual for Identifying and Analyzing Mammal Bones from Archaeological Sites in Alaska. Occasional Paper no. 18, Anthropology and Historic Preservation, Cooperative Park Studies Unit, University of Alaska, Fairbanks.
- Stein, Julie K.
- 1990. Archaeological Stratigraphy. In Archaeological geology of North America, Lasca, N. P., and Donahue, J., eds. Boulder Colorado, Geological Society of America, Centennial Special Vol. 4.
- Stuiver, M., A Long, R. S. Kra, and J. M. Devine
- 1993. Calibration 1993, Radiocarbon 35(1).
- Swarth, Harry S.
- 1934. Birds of Nunivak Island, Alaska. Los Angeles: Cooper Ornithological Club, Pacific Coast Avifauna Number 22.
- United States Bureau of Indian Affairs, ANCSA Office
- 1995. Nunivak Overview: Report of Investigations for BLM AA-9238 et al. 6 volumes. Kenneth L. Pratt, compiler, editor, and principal author. Copy on file, BIA ANCSA Office, Anchorage, Alaska.
- VanStone, James W.
- 1989. Nunivak Island Eskimo (Yuit) Technology and Material Culture. Fieldiana/Anthropology n.s. 12. Chicago: Field Museum of Natural History.
- Vogel, J. C., A. Fuls, E. Visser, and B. Becker
- 1993. Pretoria Calibration Curve for Short Lived Samples, Radiocarbon 35(1):73–86.
- Wheeler, Alwyne and Andrew K. G. Jones
- 1989. Fishes. Cambridge: Cambridge University Press.